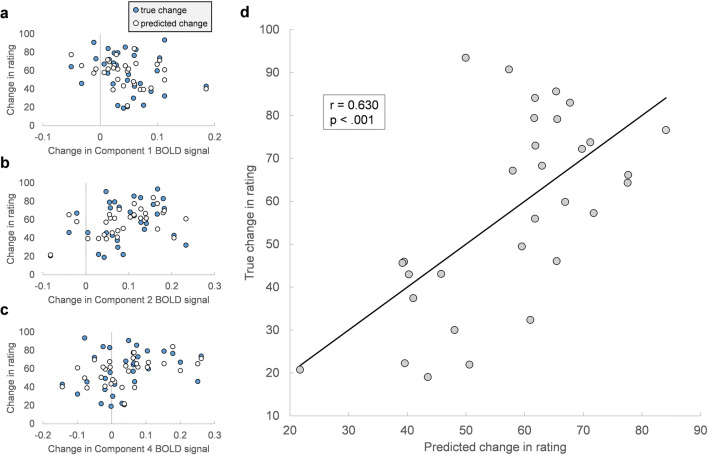
Fig. 6.
a-d Assessing model fit for within-subject pain. Temperature-dependent change in pain ratings plotted against change in BOLD signal for Component 1 (a), Component 2 (b), and Component 4 (c); true changes are shown alongside predictions made by the linear regression model. d True change in pain ratings plotted against change in ratings predicted by the model. The strength and significance of the relationship is given by Pearson r = 0.630, p < .001

