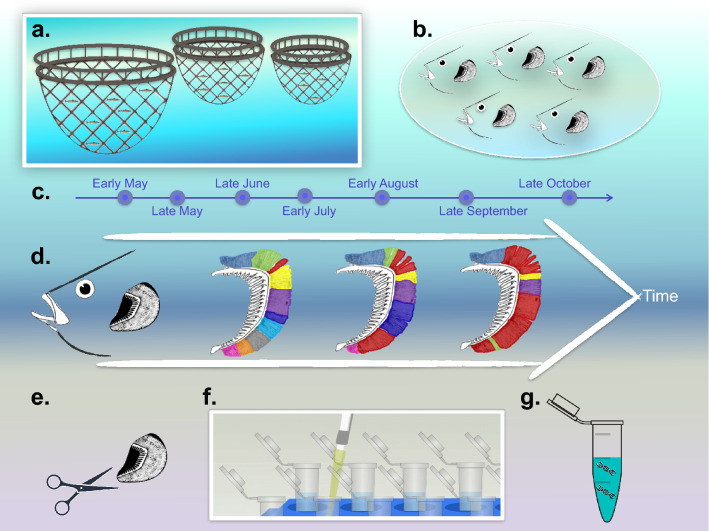
Figure 6.
Overview of the sampling campaign and analytical approach. (a) Three cages were sampled to retrieve (b) five fish from each (n = 15) at each of (c) seven timepoints (n = 105) from May through October. (d) The hypothesis underpinning the study was that the amoebic gill disease (AGD) episode and concentration of N. perurans (red shading) would be associated with a shifting microbiome. The analytical approach included (e) sampling of gill and mucus samples, (f) a newly optimised DNA extraction protocol incorporating several successive washes, and (g) downstream analyses of nucleic acids. Figure titles with *** refer to analyses that included significant differences.

