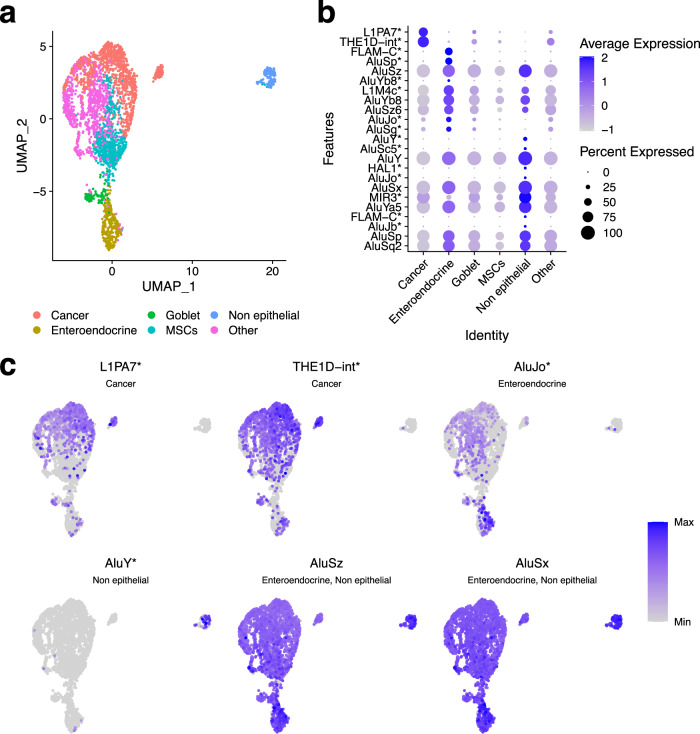
Fig. 5. TE expression detected with SoloTE during early gastric cancer.
a UMAP plot indicating the different cell types. b Dot plot depicting marker TEs per cell types (indicated on the x axis). c UMAP plots of selected TEs. Label below the TE identifier indicates the cluster at which the TE is a marker. First two TEs are differentially expressed in the cancer cells, second two TEs in the enteroendocrine and non-epithelial cells, respectively, and the last two TEs are expressed across all cells, but show increased expression in the enteroendocrine and non-epithelial cells. “*” denotes locus-specific TEs.

