Figure 3.
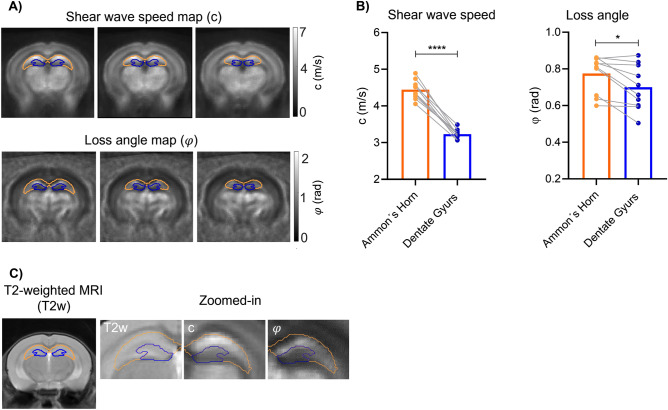
Regional in vivo MRE results. (A) Representative group averaged c- and φ-maps with Ammon´s horn (orange) and dentate gyrus (blue) masks. Image slices with distances of 210 µm correspond to the Bregma areas − 2.49, − 2.28 and − 2.07. (B) Group values of c and φ for Ammon´s horn and dentate gyrus (n = 10, *p = 0.0102, ****p < 0.0001). (C) T2-weighted MRI for anatomical orientation with magnifications of parameter maps and masks in the hippocampal region.

