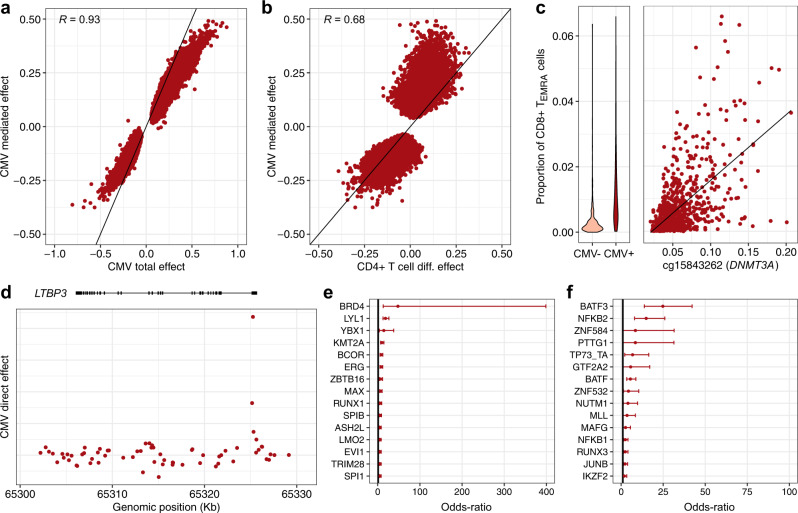
Fig. 2. Effects of cytomegalovirus infection on the blood DNA methylome.
a Total effects against cell-composition-mediated effects of CMV infection on 5mC levels. b Effects of CD4+ T cell differentiation on 5mC levels against cell-composition-mediated effects of CMV infection on 5mC levels. c Proportion of CD8+ TEMRA cells in CMV– and CMV+ donors (left panel). 5mC levels at the DNMT3A locus against the proportion of CD8+ TEMRA cells (right panel). 5mC levels are given in the β value scale. The black line indicates the linear regression line. d Genomic distribution of direct effects of CMV infection at the LTBP3 locus. e Enrichment of CpG sites with a significant direct, positive effect of CMV infection in binding sites for TFs. f Enrichment of CpG sites with a significant direct, negative effect of CMV infection in binding sites for TFs. a, b Only CpG sites with a significant cell-composition-mediated effect are shown. The black line indicates the identity line. Tests were corrected for multiple testing by the Bonferroni adjustment. a, b, d Effect sizes are given in the M value scale. e, f The 15 most enriched TFs are shown, out of 1165 tested TFs. The point and error bars indicate the odds-ratio and 95% CI. CIs were estimated by the Fisher’s exact method. Statistics were computed based on a sample size of n = 884 and for 644,517 CpG sites.

