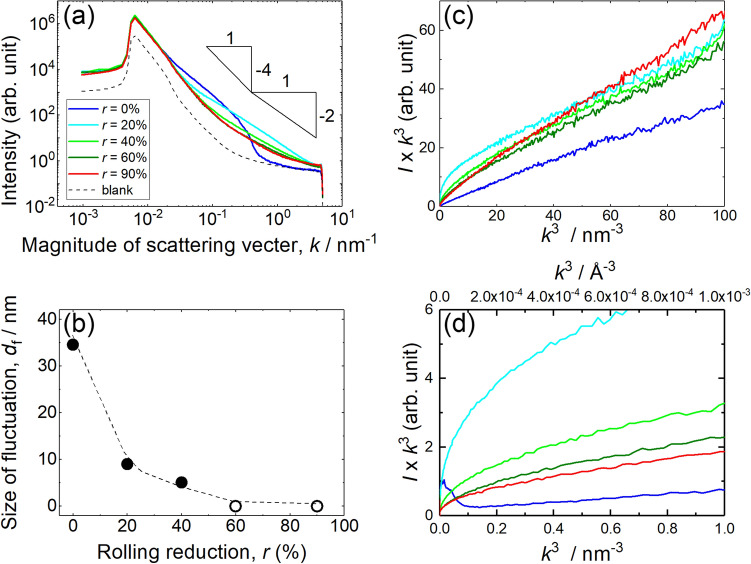
Figure 3.
Rolling reduction dependence of (a) scattering intensity versus magnitude of scattering vector for SAXS and (b) size of fluctuation evaluated from SAXS. The triangles in (a) represent the gradient of and . It is noted that white filled circles in (b) represents that the size of fluctuation is too small to be measured by SAXS. It is noted that the blank curve is shown as a reference. (c) versus plot of CrMnFeCoNi equi-atomic HEA and (d) magnified plot close to the original point of (a).

