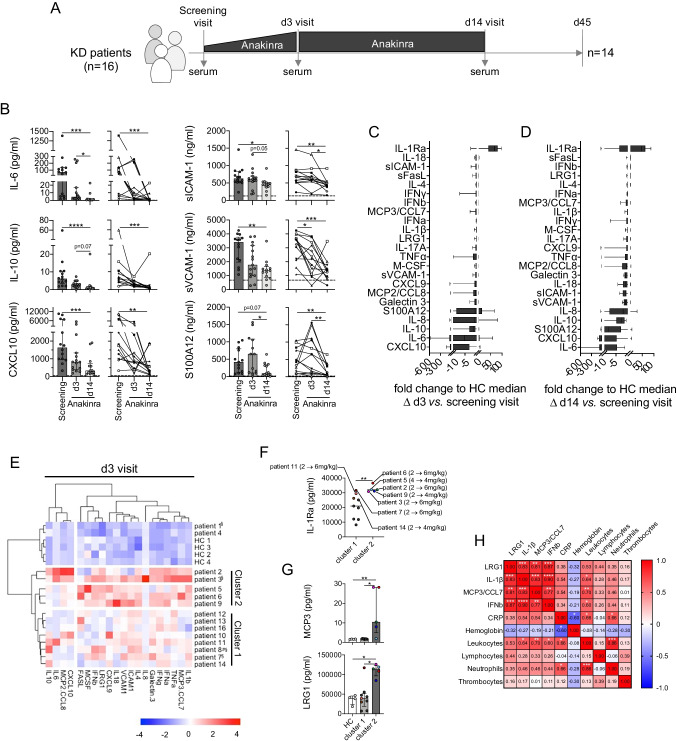
Fig. 2.
Selected serum biomarkers are most affected by IL-1R blockade and associate with the need to escalate anakinra dosage. A Schematic representation of the KAWAKINRA study protocol indicating time points of serum sampling. B Serum biomarker levels which revealed significant reduction in circulating levels upon anakinra treatment in both grouped (left panels) and individual analyses (right panels). Dashed lines indicate respective pediatric health control (n = 4) medians. Data were analyzed by Kruskal–Wallis followed by Dunn’s multiple comparison test (right panels) or Friedmann’s multiple comparison test for paired samples (left panels). C, D Anakinra-induced fold change to HC median on MFI level at days 3 (C) and 14 (D). E Ward’s unsupervised hierarchical clustering of serum biomarker levels (excluding IL1-Ra) quantified at d3 visit. Color coding indicates Z score, and clusters are annotated according to Fig. 1D. F IL-1Ra (anakinra) serum levels in study participants at d3. Color coding of patients informs on the need to escalate anakinra dosage. G Serum biomarker concentrations with significant differences between patients’ clusters. Data were analyzed by Kruskal–Wallis followed by Dunn’s multiple comparison test. H Correlation matrix of selected serum biomarker expression levels (MFI) and inflammatory parameter concentrations or cell counts. Color coding reflects Spearman correlation coefficient, and white stars indicate significance level of associations. * = p < 0.05; ** = p < 0.01; *** = p < 0.001; **** = p < 0.0001. §Patients receiving steroids alongside with anakinra; #patient 8 received only a single over-dosed injection of anakinra

