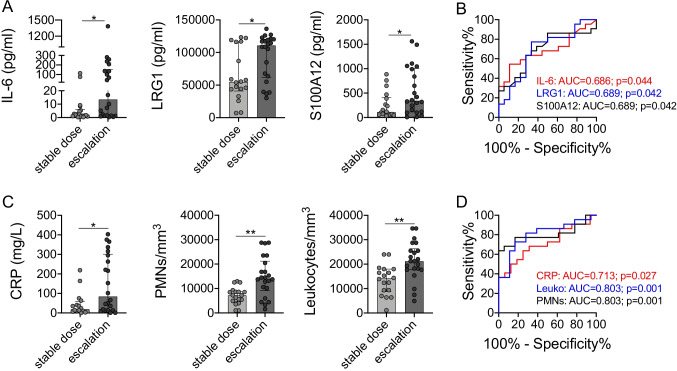
Fig. 3.
Collective serum biomarker and inflammatory parameter levels stratified by study outcome. A Collective serum biomarkers or C inflammatory parameters revealing statistically significant differences in levels when grouped according to the necessity to escalate anakinra dosage throughout the study. B, D Receiver operating curve analyses of respective biomarkers (B) or inflammatory parameters (D) associating with the necessity to escalate anakinra dosage. Data were analyzed by Kruskal–Wallis followed by Dunn’s multiple comparison (A) or Mann–Whitney U test (C). * = p < 0.05; ** = p < 0.01

