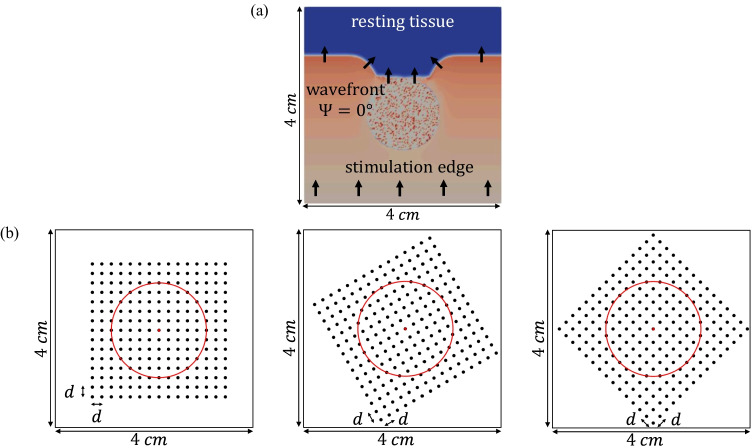
Fig. 1.
(a) Activation distribution at a particular time instant over the 2D tissue used in this work, including the fibrotic patch. Black arrows indicate propagation wavefront direction. (b) The three MEA orientations with respect to the tissue considered in this study: (leftmost), (middle) and (rightmost), where the red circle encompasses the fibrotic tissue area. It should be noted that representation in (a) refers to the relative orientation between tissue and propagation direction corresponding to

