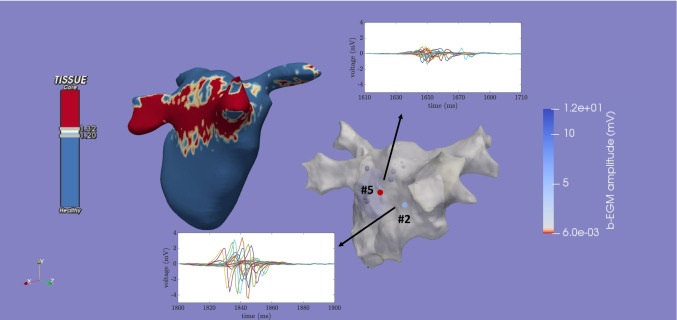
Fig. 6.
3D reconstruction of the LA geometry (gray mesh) and corresponding co-registered MRI, showing the different regional distribution patterns of gadolinium (red areas: latest contrast enhancement, blue areas: absence of latest contrast enhancement). In the geometrical mesh, two of the mapping points acquired and considered in the analysis (point #5 at fibrosis, point #2 at non-fibrosis) are marked and color-coded according to their corresponding bipolar peak-to-peak amplitude. For each of them, the atrial activation windows extracted from the twenty filtered u-EGMs recorded with the PentaRay® catheter are also displayed. Note that not all displayed u-EGMs recorded at a particular catheter site belong to a clique, see Section 2.3, and therefore affect the EIGDR indices and bipolar amplitude computations

