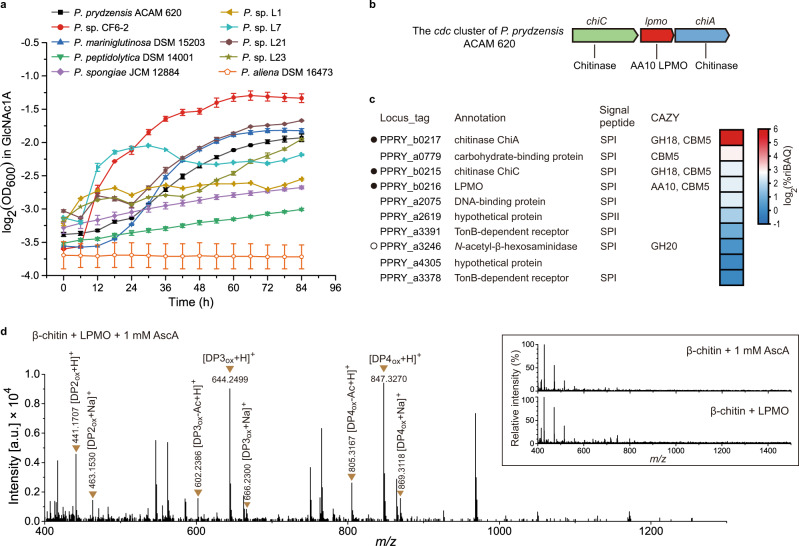
Fig. 2. Growth of chitinolytic marine Pseudoalteromonas strains on GlcNAc1A and functional analysis of the recombinant AA10 LPMO from P. prydzensis ACAM 620.
a Growth of chitinolytic Pseudoalteromonas spp. in the minimal medium supplemented with 0.2% (w/v) GlcNAc1A. The y-axis represents log2 transformation of the OD600 value. Data are presented as mean ± standard deviations (SD) (n = 2 independent experiments). b Genetic organization of the cdc cluster of P. prydzensis ACAM 620. c Heat map for the top ten most abundant proteins in the secretome of strain ACAM 620 grown on 0.5% (w/v) colloidal chitin as the sole carbon source. The colors in the heat map indicate relative protein abundance, ranging from high (red) to low abundance (blue). The data are presented as log2 transformation of the mean values of two biological replicates for each protein. These ten proteins account for 83.86% of the total protein abundance. The locus tag, protein annotation, type of signal peptides and CAZy family (glycosyl hydrolase (GH), carbohydrate-binding module (CBM) and auxiliary activity (AA)) are shown. Chitinolytic enzymes encoded by the cdc cluster are marked by solid circles and the other one by an empty circle. SpI, signal peptidase I cleavage site; SpII, signal peptidase II cleavage site. d Positive-mode Q-TOF-MS spectrum of products generated by the AA10 LPMO from strain ACAM 620 acting on 0.2% (w/v) squid pen β-chitin in the presence of 1 mM AscA. The insets show the negative control reactions without either LPMO or AscA, which did not generate detectable amounts of oxidized chitooligosaccharides. 100% relative intensity in the inserts represents 9.1 ×10³ (control reaction without LPMO) and 7.0 ×10³ (control reaction without AscA) arbitrary units (a.u.), respectively. Theoretical masses of relevant products are listed in Supplementary Table 2. DP, degree of polymerization; subscript OX, C1-oxidized chitooligosaccharides with a GlcNAc1A moiety; DP3ox-Ac, DP3ox lacking one acetyl group; DP4ox-Ac, DP4ox lacking one acetyl group. The graph shows a representative MS spectrum of at least three independent replicates. Source data are provided as a Source Data file.

