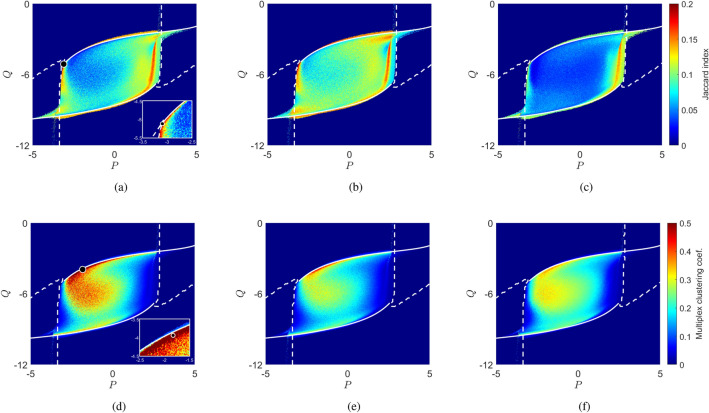
Figure 3.
Comparison of the Jaccard index (top row) and structure-function clustering (bottom row) as a function of the basal input parameters (P, Q) for the three different cortical representations considered in our investigations: (a,d) weighted network; (b,e) weighted topological network; and (c,f) binary network. Bifurcation sets for each network, obtained as described in “Large-scale neural dynamics” section are superimposed in white; the dashed curve denotes the saddle-node bifurcation set and the solid curve the Hopf bifurcation. Specific parameter choices and explored in further detail in Figs. 4, 5 are highlighted by the markers in panels (a) and (d). Insets show their positions relative to the boundaries of the region of interest and regions of high and low structure-function similarity and clustering.

