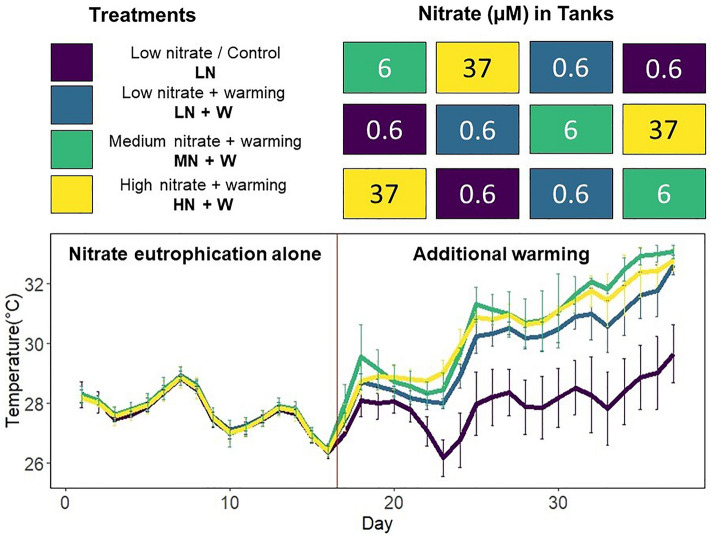
Figure 1.
Experimental design with development of temperatures per treatment. Tanks were arranged in the depicted order vertically, with four tanks on every level. The experiment lasted 37 days, and temperatures were increased gradually from day 17 in all but the low nitrate (LN) control tanks. During the first 16 days of the experiment, both low nitrate treatments (LN and LN + W) were exposed to the same conditions. This changed as temperatures in the LN + W treatment increased together with the MN + W and HN + W treatments.

