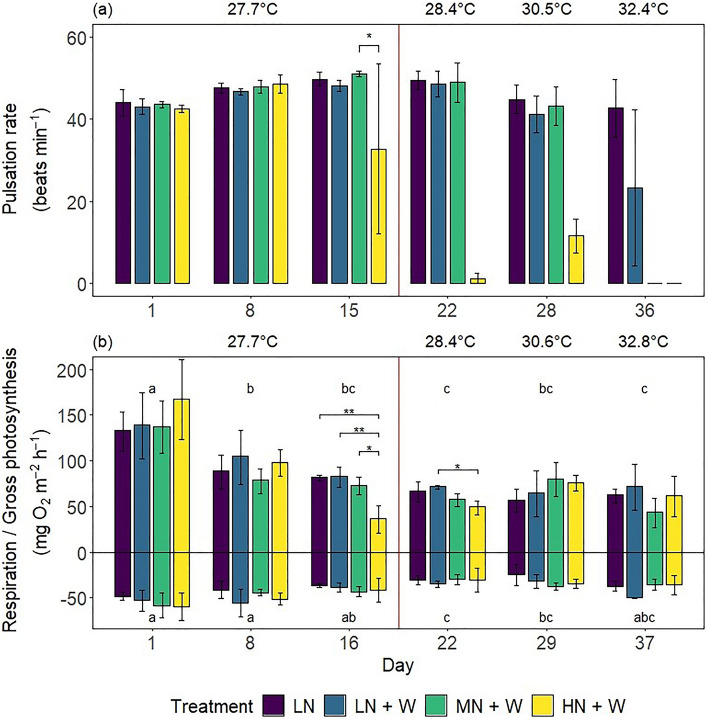
Figure 3.
(a) Pulsation rates and (b) gross photosynthesis (Pgross) and respiration (R) of Xenia umbellata colonies from control tanks with low nitrate (LN, ~ 0.6 μM) and three treatments: LN + W = low nitrate (~ 0.6 μM) + warming from day 17; MN + W = medium nitrate eutrophication (~ 6 μM) + warming from day 17; HN + W = high nitrate eutrophication (~ 37 μM) + warming from day 17. Error bars represent standard deviations of three replicates. Temperatures represent mean temperatures of the respective days, excluding controls. Different letters in (a) indicate significant differences between days (pwc, Bonferroni adjustment, t-test, p < 0.05). Asterisks represent significant differences between treatments within days (pwc, Bonferroni adjustment, (a) t-test & (b) Dunn's test, ** = p < 0.005, * = p < 0.05).

