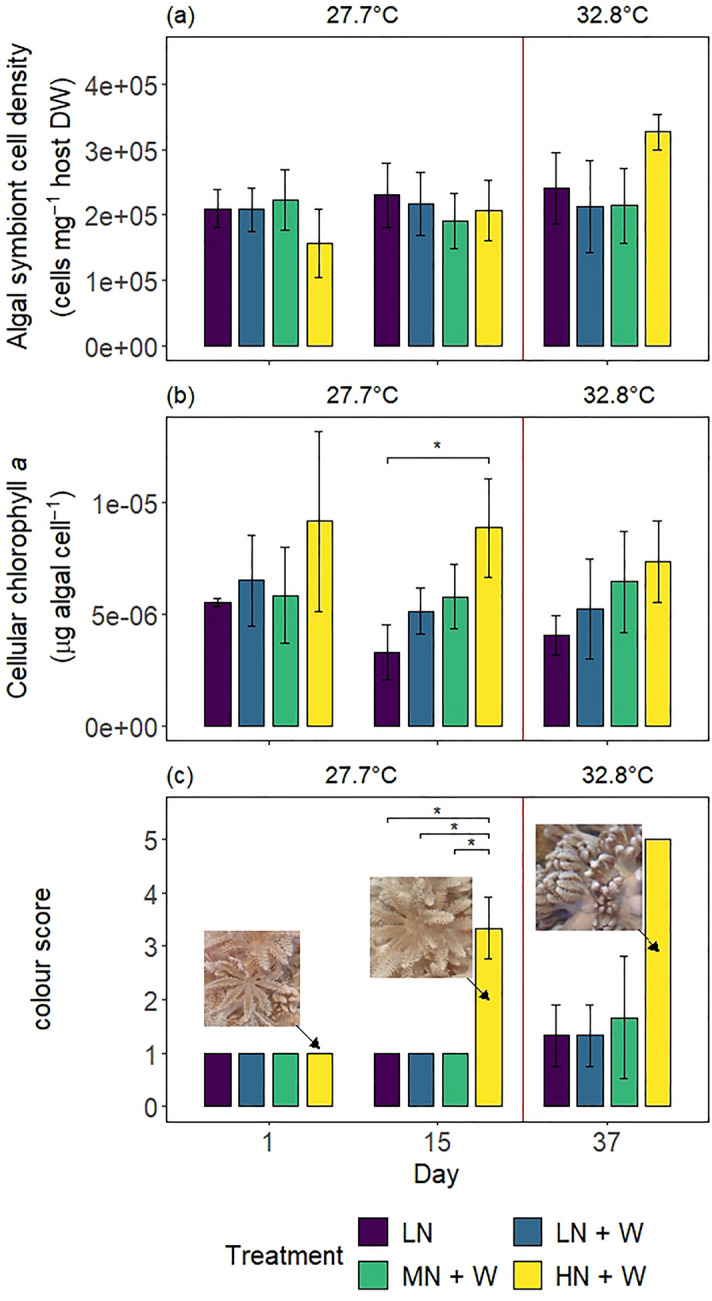
Figure 4.

(a) Algal symbiont cell density, (b) chlorophyll a content standardized to cell density, and (c) colour scores (definitions in Supplementary Table S2, see also Supplementary Fig. S3) of Xenia umbellata colonies from control tanks with low nitrate (LN, ~ 0.6 μM) and three treatments: LN + W = low nitrate (~ 0.6 μM) + warming from day 17; MN + W = medium nitrate eutrophication (~ 6 μM) + warming from day 17; HN + W = high nitrate eutrophication (~ 37 μM) + warming from day 17. Error bars represent standard deviations of three replicates, with one exception of two replicates for the LN + W treatment on day one for both, (a) and (b). Temperatures represent mean temperatures of the respective days, excluding controls (LN). Asterisks represent significant differences between treatments within days (pwc, Bonferroni adjustment, t-test (b) or Dunn’s test (c), * = p < 0.05). Post-hoc test in (c) was conducted excluding day 1. Pictures in (c) show representative polyps of one identical X. umbellata colony in the high nitrate treatment at the respective time points (as indicated by arrows). Images in (c) by Lisa Zimmermann.
