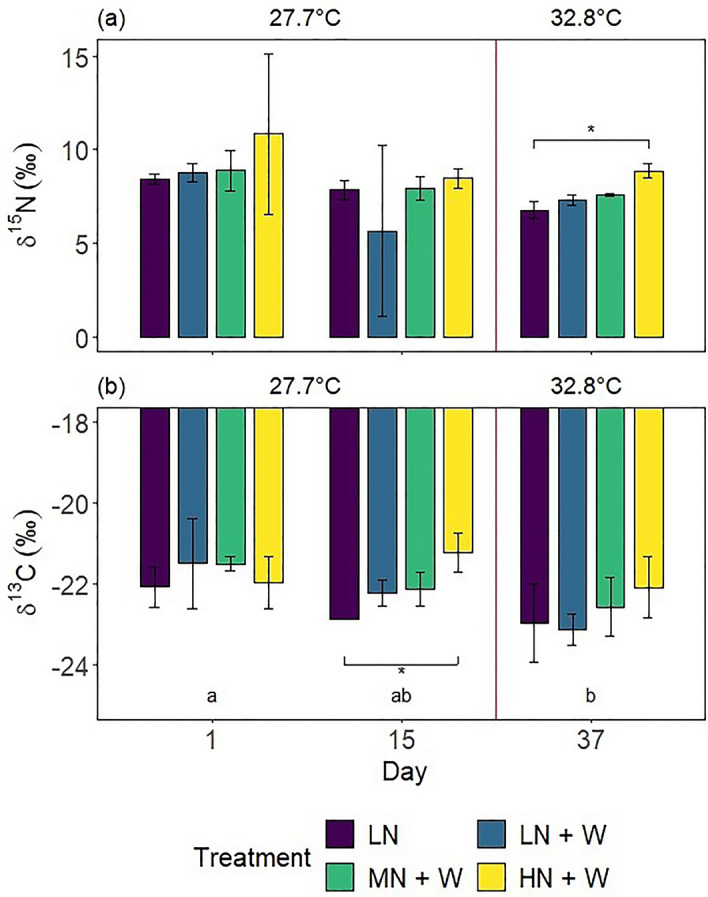
Figure 6.

(a) Nitrogen and (b) carbon stable isotope ratios of Xenia umbellata colonies from control tanks with low nitrate (LN, ~ 0.6 μM) and three treatments: LN + W = low nitrate (~ 0.6 μM) + warming from day 17; MN + W = medium nitrate eutrophication (~ 6 μM) + warming from day 17; HN + W = high nitrate eutrophication (~ 37 μM) + warming from day 17. Error bars represent standard deviations of three replicates, with exceptions of two replicates for controls (LN) on day 15 (b) and the LN + W treatment on day 37 (a & b). Temperatures represent mean temperatures of the respective days, excluding controls. Different letters in (b) indicate significant differences between days (pwc, Bonferroni adjustment, t-test, p < 0.05). Asterisks indicate significant differences between treatments within days (pwc, Bonferroni adjustment, (a) Dunn’s test, (b) t-test, * = p < 0.05).
