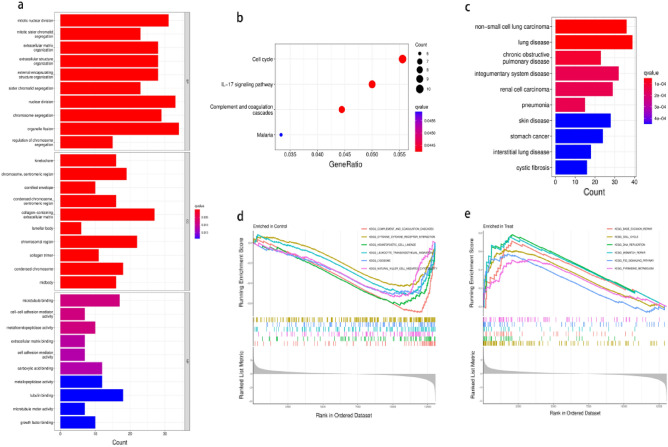
Figure 3.
Functional enrichment analysis of DEGs. The P value represents the colour depth of the node. The size of the node implies the number of DEGs. (a) GO functional enrichment analysis results for DEGs, including Biological process(BP), molecular function(MF) and cellular component(CC). (b) KEEG enrichment analysis reveals signalling pathways highly relevant to NSCLC. (c) DO functional enrichment analysis results of DEGs. (d) GSEA shows the top six signalling pathways most associated with normal lung tissue. (e) GSEA shows the top six signalling pathways most associated with NSCLC.

