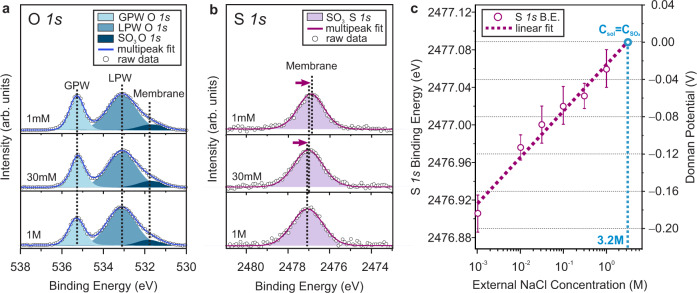
Fig. 2. Experimental measurements of the Donnan potential.
Representative a O 1s and b S 1s core level spectra collected from CR-61 membranes equilibrated with different concentrations of NaCl solutions (GPW: gas phase water, LPW: liquid phase water). The binding energy is calibrated using bulk liquid phase water. The effects of the EDL on the binding energy position of the LPW peak are considered, and corrections are made during the calibration process. (Details of the energy calibration process are set forth in Supplementary Note 4) Circles represent raw experimental data, and lines indicate the sum of fits. Representative spectra not provided here for three other concentrations of NaCl solutions are presented in Supplementary Fig. 6 for visual inspection. c Averaged S 1s binding energy and the corresponding Donnan potential values as a function of the external solution concentration. Note that the S 1s binding energy shift versus Donnan potential shows a linear dependence of ∼1 eV/V. Error bars that represent the experimental uncertainty in S 1s binding energy were determined from the standard deviation of repeated measurements of a minimum of five different locations in each case. The binding energy values of fitted core level components for each individual analysis position are provided in Supplementary Table 6. The dashed line represents the best fit to a linear dependence. The fitted line was extrapolated to the equivalent concentration of counter-ions (3.2 M), where the Donnan potential approaches 0 V17.

