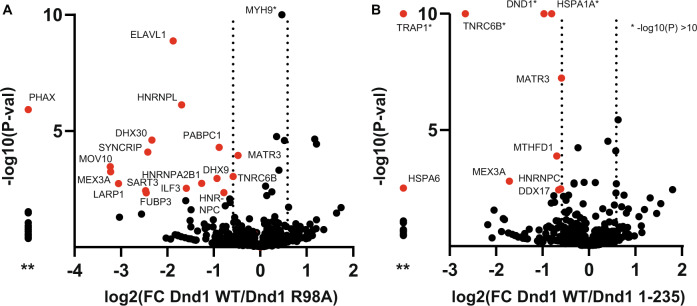
Fig. 6. Proteomics analysis revealed differential interaction networks of targets of mutant versus WT DND1.
In total, 769 proteins were quantified and used for t-testing to generate the volcano plot indicating the log2 fold change (FC Dnd1 WT/Dnd1mut) ratio on the x axis and −logP value on the y axis for each protein. * Shows proteins with −log(P val) > 10. A 17 proteins (in red) were present at at least 1.5-FC lower levels in the R98A RNA-binding mutant as compared to DND1 WT. B Nine proteins (in red) were present at at least 1.5-fold change lower levels in the 1–235 dsRBD-truncation mutant as compared to DND1 WT. Multiple two-sided t-tests were performed using FDR = 10%, see Supplementary Data 1. ** In both panels, the column left of the y axis shows proteins present in WT but completely missing in the mutants. Source data is provided in columns G, H, O, and P in the t-tests sheet of Supplementary Data 1, raw data are deposited at ProteomeXchange (see “Data availability”).

