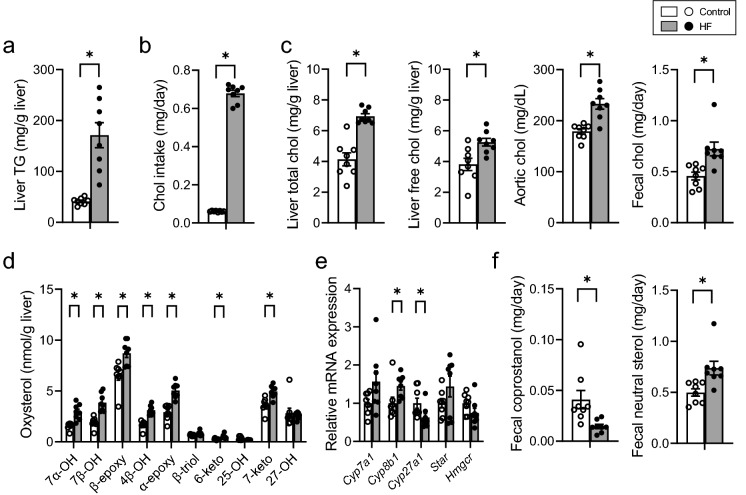
Figure 1.
Distribution of chol-related molecules in mice fed control or HF diet. (a) Hepatic TG concentration. (b) Daily chol intake. (c) Chol concentration in the liver, blood, and feces. (d) Concentration of liver oxysterols. (e) mRNA expression of genes involved in chol metabolism. (f) Coprostanol and neutral steroid excretion per day. Open bars, n = 8 for control; filled bars, n = 8 for HF. Data presented in E was normalized to Gapdh mRNA expression. Values are shown as the mean ± SEM (n = 8). Asterisks indicate a significant difference compared with the control (P < 0.05).

