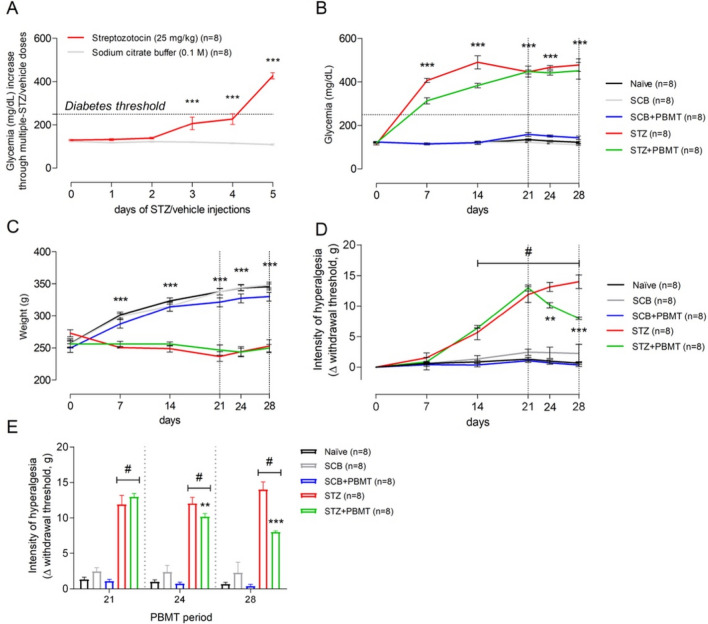
Figure 1.
PBMT decreases the hyperalgesia of T1D rats without changing their glycemia or weight. (A) Average morning glycemia (red line) from rats during the protocol of T1D induction by multiple STZ low-doses; dotted horizontal black line: established diabetes threshold (glucose ≥ 250 mg/dL). (B) Rats from STZ (red line) and STZ + PBMT (green line) groups showed high levels of hyperglycemia at 7, 14, 21, 24, and 28 days. (C) Rats from STZ (red line) and STZ + PBMT (green line) groups stopped gaining weight after the installation of diabetes. (D) Data from mechanical withdrawal thresholds (Δ; g; the intensity of hyperalgesia) show that PBMT reduced significantly the intensity of hyperalgesia of the STZ + PBMT group (green line) in comparison with the STZ group (red line), at the 24th and the 28th days. (E) Bar graph emphasizing the PBMT anti-hyperalgesic effect during the period comprised between the 21st and the 28th days. In (A–C), symbol (***) means a significant difference (p < 0.001) between diabetic groups and controls (Two-way ANOVA followed by Bonferroni posthoc test). In (D) and (E), symbols (**) and (***) mean significant difference (p < 0.01 and p < 0.001, respectively) between STZ and STZ + PBMT groups (Two-way ANOVA followed by Bonferroni posthoc test); symbol (#) means significant difference (p < 0.001) between STZ-induced groups in comparison to control groups (Two-way ANOVA followed by Bonferroni posthoc test [D]; One-way ANOVA followed by Bonferroni posthoc test [E]). Data are expressed as mean ± S.E.M.; vertical dotted black lines indicate the PBMT period.

