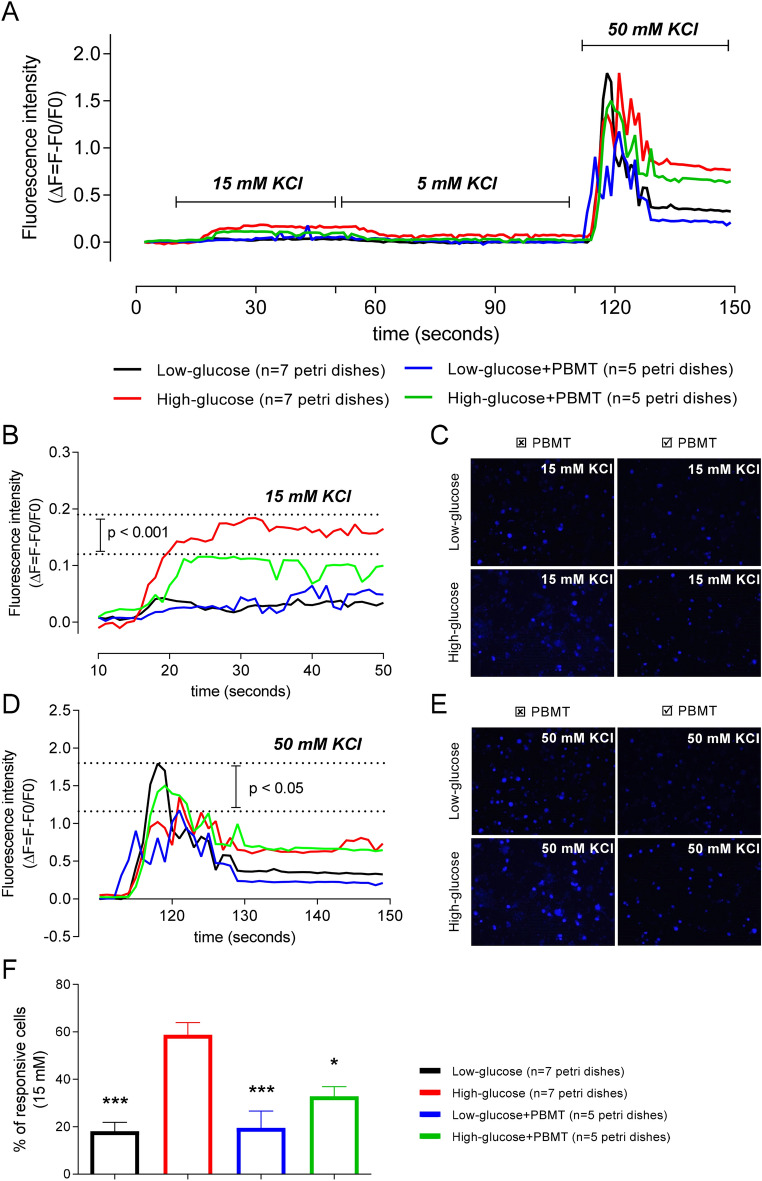
Figure 9.
PBMT decreases the calcium dynamics of DRG neurons increased by hyperglycemia. Fluorescence intensity (ΔF = F − F0/F0) was analyzed in DRG neurons cultivated in low- (black line) or high-glucose (red line) media for 24 h and exposed to PBMT (green and blue lines) right before the test. (A) General representation of fluorescence intensities (ΔF = F − F0/F0) after extracellular stimuli with 5 mM (basal), 15 mM (intermediary), and 50 mM (high) of KCl; ↑[K+]e was used to generate Ca2+ influx in DRG neurons incubated with FLUO-4 AM. (B) During the intermediary stimulus (15 mM KCl), there was a significant difference in the ΔF when comparing the High-glucose and High-glucose + PBMT groups (comparison was done considering the ΔF delimited by the horizontal dotted lines); Two-way ANOVA followed by Bonferroni posthoc test. (C) Snap-acquired images of the DRG cell culture during the time-lapse, right after the stimulus with 15 mM KCl. (D) At the high stimulus (50 mM KCl), there was a significant difference between the Low-glucose and Low-glucose + PBMT groups. (E) Snap-acquired images of the DRG cell culture during the time-lapse, right after the stimulus with 50 mM KCl. (F) Percentage (%) of responsive cells during the 15 mM stimulus; in the High-glucose group, about 60% of all responsive cells, i.e., cells with increased fluorescence during the 50 mM KCl stimulus (positive control), also responded to the intermediary stimulus (15 mM KCl), being statistically different from the other groups. Data are expressed as mean ± S.E.M.; symbols (*) and (***) mean p < 0.05 and p < 0.001, respectively, in comparison to the High-glucose group; One-way ANOVA followed by Bonferroni posthoc test.

