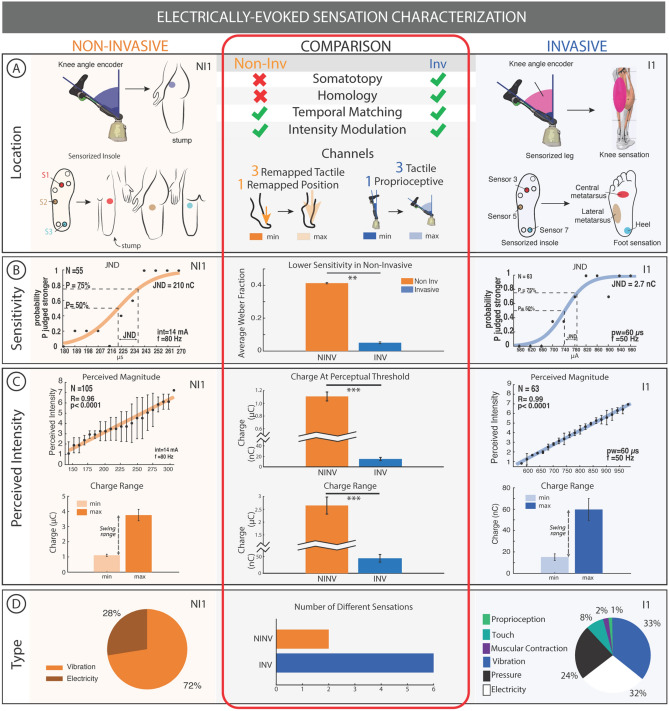
Figure 2.
Electrically evoked sensation characterization. (A) Sensory feedback is mapped to the thigh with (NI1) and the foot sole + gastrocnemius muscle (I1) perceived magnitude. (B) The sensitivity of both NI1 and I1 is shown through their just noticeable difference (JND). (C) In both NI1 and I1, the perceived intensity increases with charge injected. The charge range is on the order of µC and nC for NI and I respectively. (D) Type of sensation and proportion of natural sensations for NI1 and I1 are presented in pie charts. All error bars indicate standard error. *p < 0.05, **p < 0.01, ***p < 0.001. Further results for NI2 and I2 are presented in Supplementary Figure S2A. The right column in panels A, B, C, and D are taken with permission from Preatoni et al.5.

