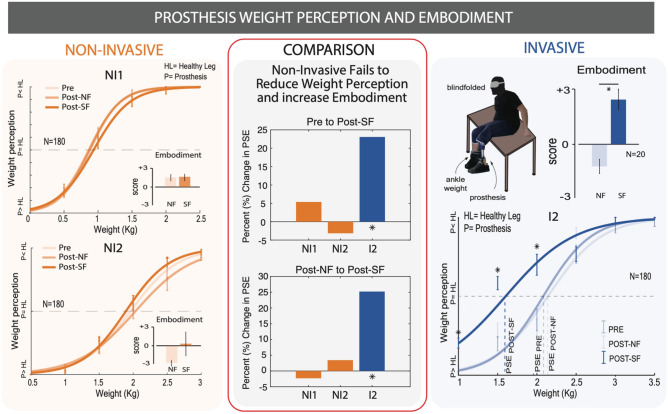
Figure 4.
Weight perception and embodiment. subjects performed a weight perception discrimination task before and after a sensory feedback task and no feedback task. Psychometric curves representing their perceived prosthesis weight are presented for NI subjects and I subjects. Statistical significance for specific test weights is marked with *p < 0.05. Self-reported embodiment on a −3 to 3 Likert scale are also shown as graph insets. A comparison between NI and I performance is drawn. The right column is taken with permission from Preatoni et al.5.

