
Figure 2.
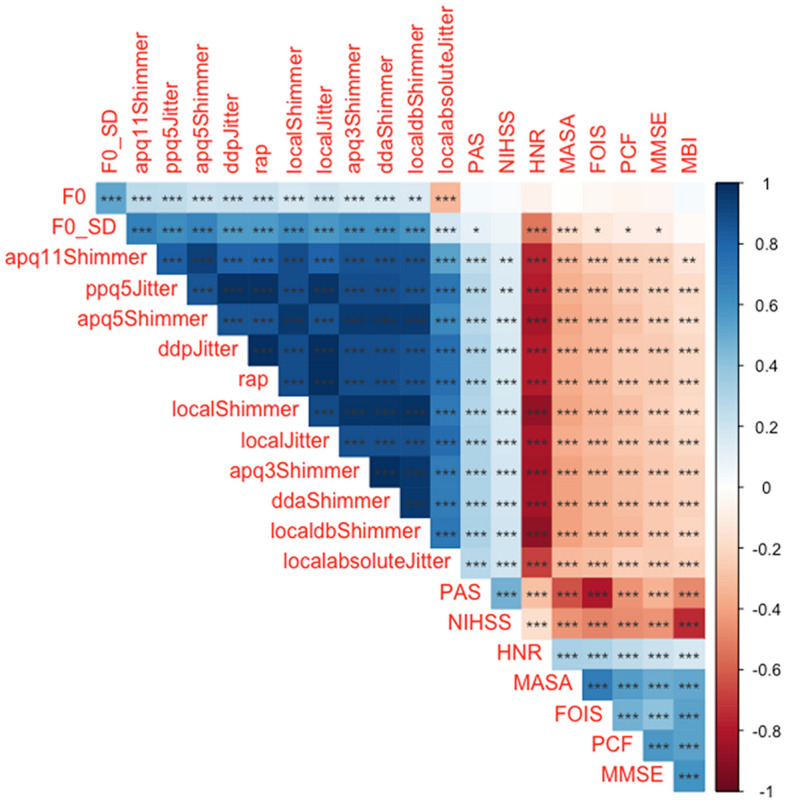
Correlation analysis between the Praat features and the clinical parameters. The correlation graph shows that nearly all the voice features showed significant association with the clinical parameters, especially with those related to swallowing, and peak cough flow values. An exception was observed with the fundamental frequencies, which failed to show any association with the clinical parameters. *p < 0.05; **p < 0.01; ***p < 0.001. HNR harmonic to noise ratio, F0 fundamental frequency, MBI modified barthel index, NIHSS national institutes of health stroke scale. F0 fundamental frequency, SD standard deviation, APQ amplitude perturbation quotient, PPQ period perturbation quotient, RAP relative average perturbation, PAS penetration-aspiration scale, NIHSS national institutes of health stroke scale, HNR harmonic to noise ratio, MASA mann assessment of swallowing ability, FOIS functional oral intake scale, PCF peak cough flow, MMSE mini-mental state examination, MBI modified barthel index.