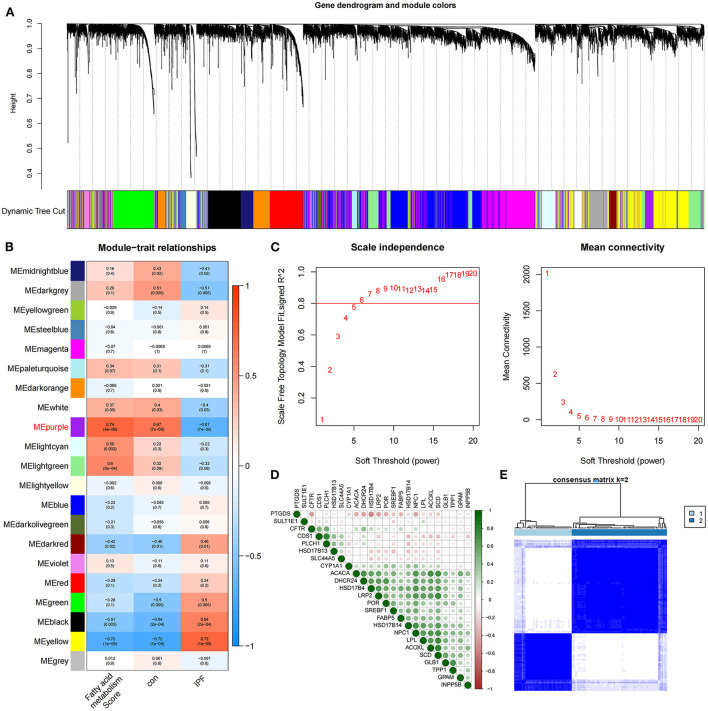
Figure 1.
Identification of core FAMRGs in IPF. (A) WGCNA analysis was performed on the training set to obtain the cluster tree of co-expressed genes. (B) Construct module-trait relationships, with each module containing the corresponding correlation and P-value. (C) Soft threshold of scale-free network. (D) The interaction of 24 core FAMRGs. (E) Heatmap of the matrix of co-occurrence information for IPF samples.

