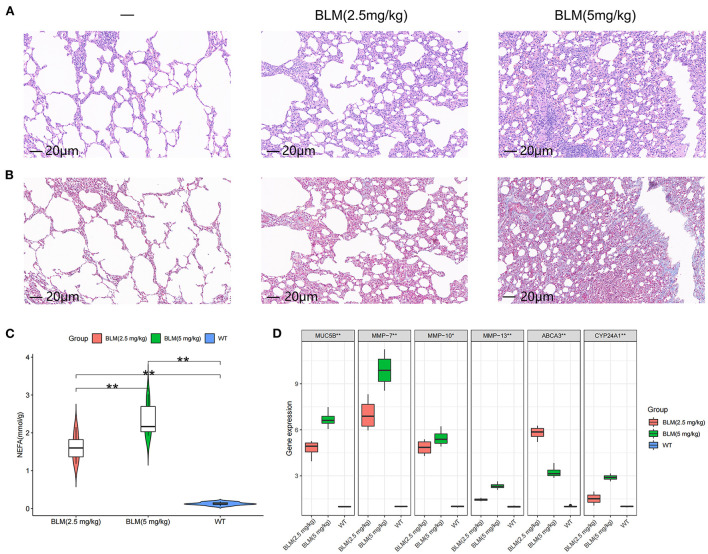
Figure 4.
Expression levels of fibrosis markers and fatty acid metabolism in rats with different degrees of pulmonary fibrosis. (A) Photomicrographs of lung sections stained with H&E. (B) Photomicrographs of lung sections stained with Masson Trichrome staining. (C) Content of free fatty acids in lung tissues of rats in each group. (D) Gene expression levels of fibrosis markers and key diagnostic genes in lung tissues of rats in each group. *P < 0.05, **P < 0.01, ***P < 0.001.

