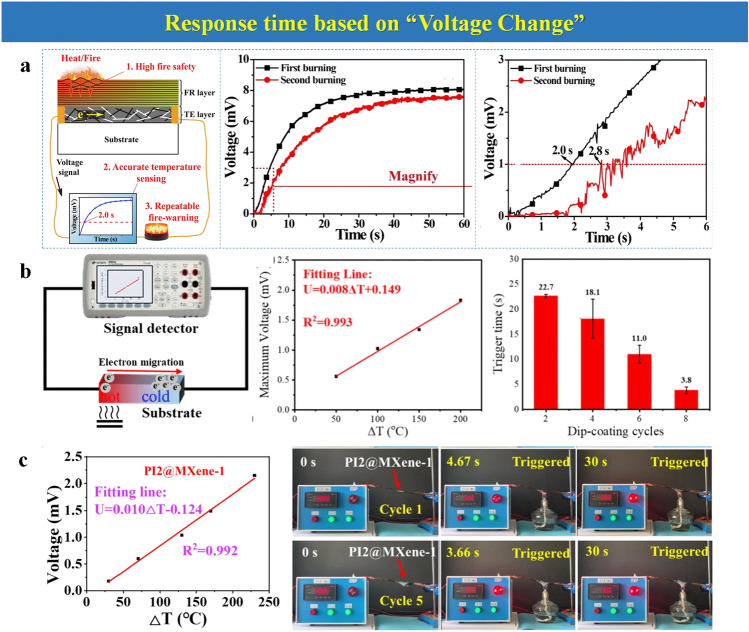
Fig. 5.
a Schema illustration of a fire-warning nano-coating; output voltage curve over heating time in the first and second heating test.
Reproduced with permission from Ref. [55]. Copyright 2021 Elsevier B.V. b Scheme illustration of thermoelectric effect. The relationship between voltage and temperature difference. Reproduced with permission from Ref. [67]. Copyright 2022 Elsevier B.V. c The trigger time of matrix with different dip-coating cycles. Reproduced with permission from Ref. [35]. Copyright 2022 Elsevier B.V

