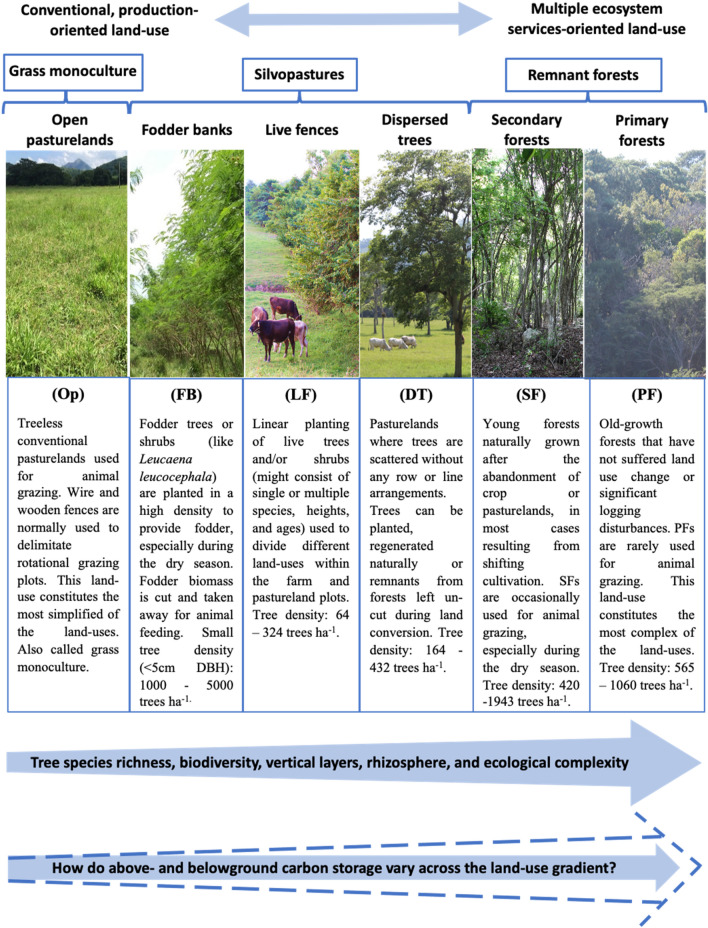
Figure 1.
Illustration and description of the land-use gradient from conventional open pasturelands (OP), fodder banks, (FB) live fences (LF), pasturelands with dispersed trees (DT), secondary forests (SF) to primary forests (PF) selected for carbon monitoring. Land-uses followed an intensity gradient from ecologically simple to complex systems. The photographs were taken by Deb Raj Aryal from Chiapas (OP, FB, DT, PF) and Campeche (SF), Mexico. The animals in the images were to represent that the lands we sampled are used for animal grazing.

