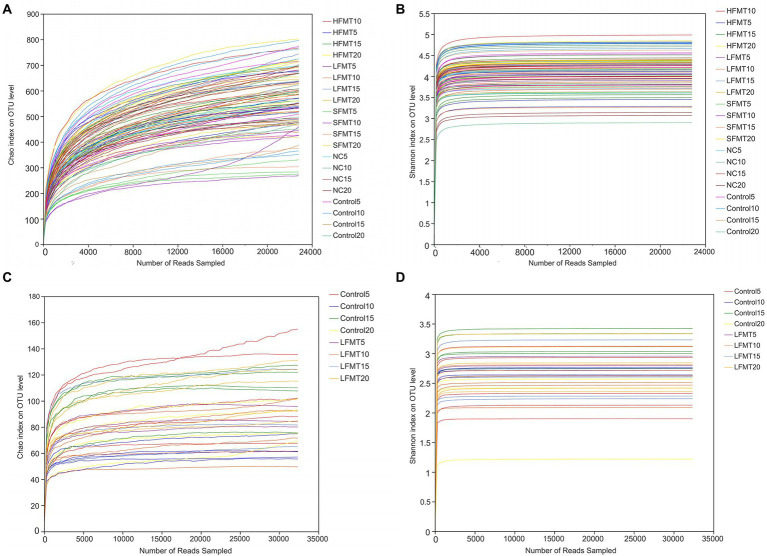
Figure 2.
Sparsity curve analysis of stool samples. (A) Bacterial dilution curve based on Chao index. (B) Bacterial dilution curve based on Shannon index. (C) Fungal dilution curve based on Chao index. (D) Fungal dilution curve based on Shannon index. The x-axis represents the amount of randomly sampled sequencing data; the y-axis represents the number or diversity index of observed species. Each curve shown in the graph with a different color represents a sample.

