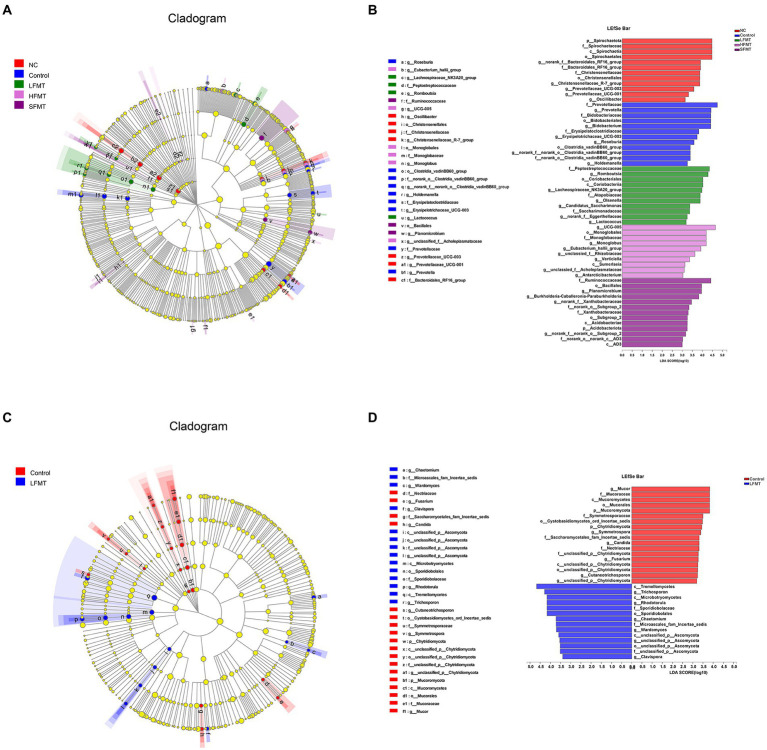
Figure 6.
LEfSe analysis comparing the differential microbiota among groups. Clade diagram showing the phylogenetic distribution of microbial lineages across different FMT groups. Differences in abundance between groups were assessed using LDA scores. (A) Phylogenetic distribution of bacterial microbiota associated with FMT group and untreated group taxa. (B) LDA > 3 differential bacteria in bacterial communities associated with FMT and untreated groups. (C) Phylogenetic distribution of fungal microbiota associated with FMT group and untreated group taxa. (D) Differential fungi with LDA > 3 in the fungal community associated with the FMT group and the untreated group. The colored circles from the inside to the outside of the LEfSe analysis cladogram represent different taxonomic levels (phylum, class, order, family, genus). The diameter of each circle is proportional to the abundance of the population. The yellow circles in the cladogram represent taxa that are not significantly different. LDA scores > 3 were considered statistically significant. Different colored areas represent different components.

