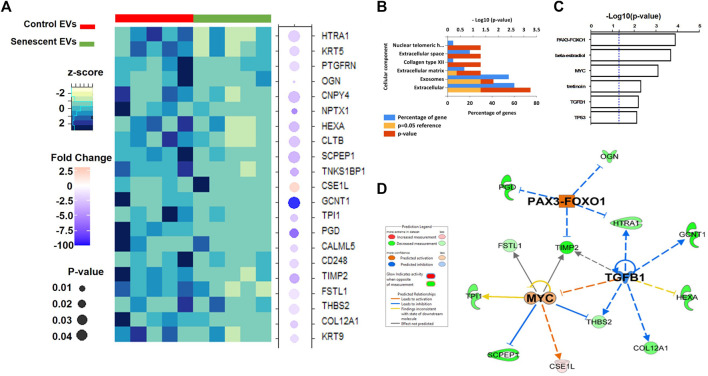
FIGURE 4.
Differentially abundant proteins identified in senescent EVs. (A) Heatmap of differentially abundant protein contents in EVs (See Table 3). (B) Functional enrichment analysis of proteomics data. (C) Enriched upstream regulators from IPA analysis. (D) Network analysis of identified upstream regulators and their predicted relationship with EV proteomics data.

