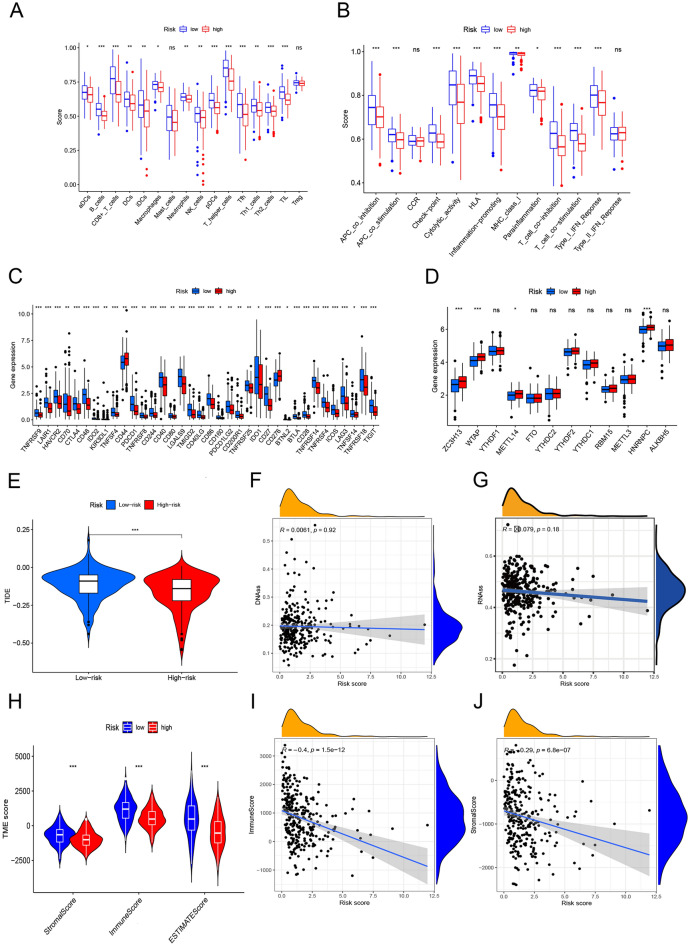
Figure 12.
Immune correlation analysis. Boxplots of immune cell (A) and immune-related function (B) scores in the two risk subgroups. The differential expression based on the immune checkpoints (C), m6A-related genes (D) and TIDE scores (E) between the low-risk and high-risk groups. (F–G) Correlation between the risk scores and stem cells. (H) Violin plots show that the proportion of TIME scores vary between the high-risk and low-risk groups. (I–J) Correlation among the immune cells, stromal cell scores and risk scores.

