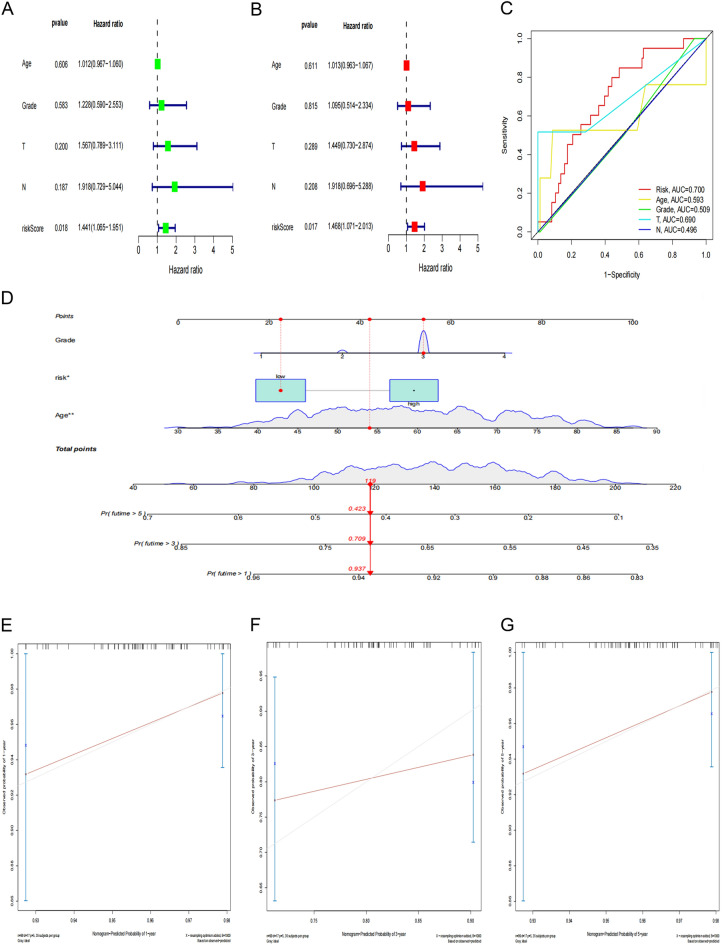
Figure 8.
Independent prognostic value of risk score model. (A–B) Univariate and multivariate COX regression analysis on OS in the TCGA cohort. (C) Clinical ROC curves to forecast overall survival of patients. (D) Establishment of nomogram in forecasting OS rates at 1-year, 3-year and 5-year survival probabilities. (E–G) Nomogram calibration curves are used to investigate the predictive results and deviations of actual 1-year, 3-year and 5-year survival probabilities.

