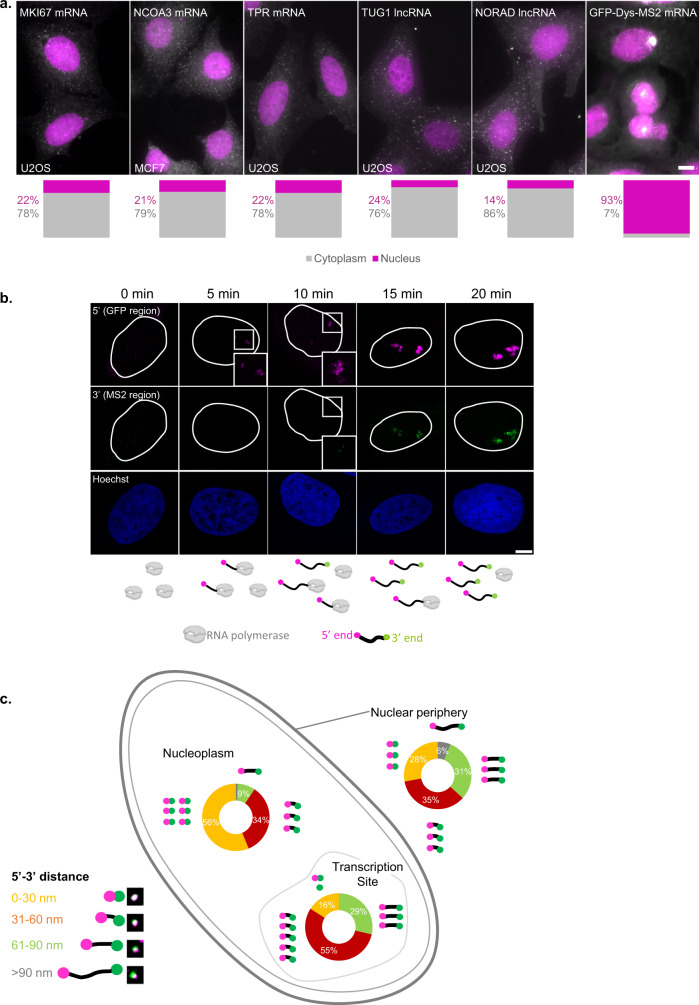
Fig. 1. mRNAs change their compaction state during travels through the nucleus.
a Wide-field images showing RNA smFISH on five different mRNA and lncRNA transcripts (white) along with nuclei (magenta) in U2OS and MCF7 cells. Cytoplasm/nucleus (C/N) ratios for each transcript (gray—cytoplasm, magenta—nucleus) are presented below (n = 30 cells for each transcript). Scale bar, 10 µm. b Confocal images showing activated sites of transcription where the 5’-end (magenta) of GFP-Dys is the first to be transcribed, followed by 3’-end (green). The outlines of the nuclei were traced from the Hoechst images. Boxed areas are enlarged. The scheme at the bottom shows the formation of the transcripts at each time point. The scheme was created with BioRender.com. Scale bar, 8 µm. c Summary of the frequency of various 5’–3’ distances measured in the transcripts located in three different regions of the nucleus and the levels of compaction (transcription site, n = 147 transcripts; nucleoplasm, n = 617 transcripts; nuclear periphery, n = 276 transcripts). Each transcript cartoon represents 10% of the total transcripts measured. Examples of images of the various transcripts are shown in the legend. Source data are provided as a Source Data file.

