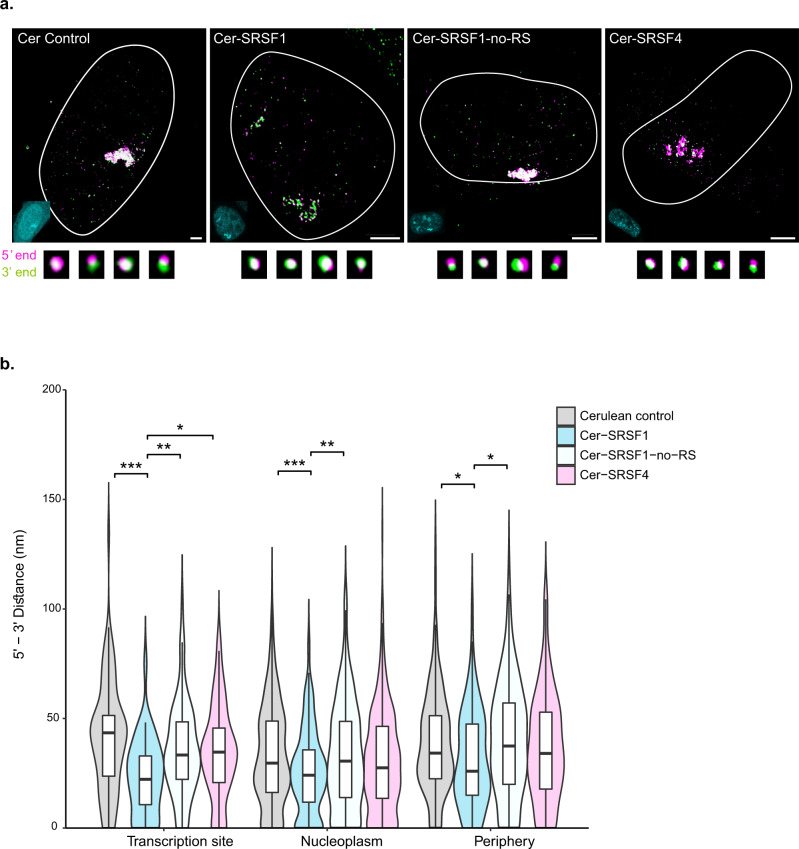
Fig. 2. The effects of SR overexpression on mRNA compaction.
a Representative cells expressing GFP-Dys-MS2 transcripts transfected with Cerulean-N1, Cer-SRSF1, Cer-SRSF1-no-RS, or Cer-SRSF4. Large foci are the active transcription sites and the small dots are the mRNAs. The outlines of the nuclei were traced from the Hoechst images. Fluorescent images of the nuclei appear at the bottom left (cyan). Examples of various transcripts are shown below. Scale bar, 5 µm. Adjustments to individual color channels were made. b Violin plots depicting changes in mRNA compaction (5’ to 3’ distance measurements) under overexpression of different SR proteins. Cerulean control n = 720 transcripts, Cer-SRSF1 n = 393 transcripts, Cer-SRSF4 n = 508 transcripts, Cer-SRSF1-no-RS n = 508 transcripts. (Transcription site: Kruskal–Wallis, χ2(3) = 17.531, p = 0.0005. Pairwise comparisons- two-sided Mann–Whitney tests with Benjamini–Hochberg FDR correction, Cerulean control vs. Cer-SRSF1 p = 0.0003, Cerulean control vs. Cer-SRSF1-no-RS p = 0.1491, Cerulean control vs. Cer-SRSF4 p = 0.1491, Cer-SRSF1 vs. Cer-SRSF1-no-RS p = 0.0094, Cer-SRSF1 vs. Cer-SRSF4 p = 0.0168, Cer-SRSF1-no-RS vs. Cer-SRSF4 p = 0.9103. Nucleoplasm: Kruskal–Wallis, χ2 (3) = 16.374, p = 0.0009. Pairwise comparisons- two-sided Mann–Whitney tests with Benjamini–Hochberg FDR correction, Cerulean control vs. Cer-SRSF1 p = 0.0005, Cerulean control vs. Cer-SRSF1-no-RS p = 0.6236, Cerulean control vs. Cer-SRSF4 p = 0.1289, Cer-SRSF1 vs. Cer-SRSF1-no-RS p = 0.007, Cer-SRSF1 vs. Cer-SRSF4 p = 0.0594, Cer-SRSF1-no-RS vs. Cer-SRSF4 p = 0.3742. Periphery: Kruskal–Wallis, χ2(3) = 8.2911, p = 0.0403. Pairwise comparisons- two-sided Mann–Whitney tests with Benjamini–Hochberg FDR correction, Cerulean control vs. Cer-SRSF1 p = 0.032, Cerulean control vs. Cer-SRSF1-no-RS p = 0.5516, Cerulean control vs. Cer-SRSF4 p = 0.5516, Cer-SRSF1 vs. Cer-SRSF1-no-RS p = 0.032, Cer-SRSF1 vs. Cer-SRSF4 p = 0.2201, Cer-SRSF1-no-RS vs. Cer-SRSF4 p = 0.4191). *p < 0.05, **p < 0.005, ***p < 0.001. Boxplots show the distance (nm) (center line, median; box limits, upper and lower quartiles; whiskers, 1.5× interquartile range). Source data are provided as a Source Data file.

