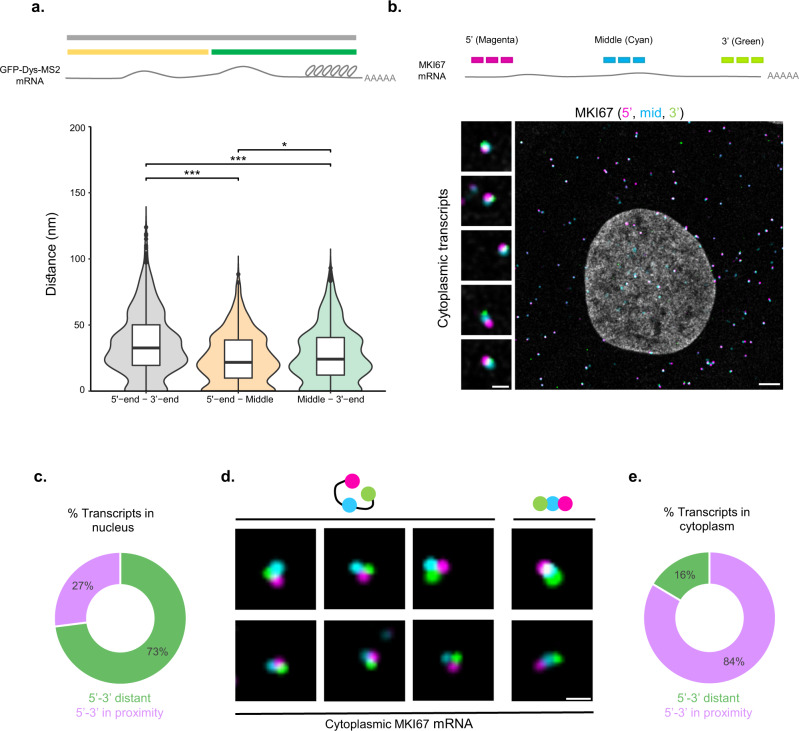
Fig. 3. Nucleoplasmic mRNAs are mostly rod-shaped.
a Scheme of the GFP-Dys-MS2 mRNA and the distances measured. Violin plot depicting start-to-end, start-to-middle and middle-to-end distances at three different nuclear regions. 5’–3’ n = 1040; 5’-mid n = 746; mid-3’ n = 917 transcripts. (Kruskal–Wallis, χ2(2) = 12.825, p < 0.0001. Pairwise comparisons—two-sided Mann–Whitney tests with Benjamini–Hochberg FDR correction, 5'-end–3'-end vs. 5'-end-Middle p < 0.0001, 5'-end – 3-end vs. Middle-3'-end p < 0.0001, 5'-end-Middle vs. Middle-3'e-nd p = 0.013). *p < 0.05, ***p < 0.001. Boxplots show the distance (nm) (center line, median; box limits, upper and lower quartiles; whiskers, 1.5× interquartile range; dots, outliers). b Scheme showing the sites of recognition between probe sets and the different mRNAs. MKI67 mRNA in U2OS cells, tagged with three sets of probes (5’—magenta, middle—cyan, 3’— green). Left- enlargements of example mRNAs demonstrating several orientations of the mRNA. Scale bar, 5 µm. c Plot showing the shape of nuclear MKI67 transcripts in U2OS cells (5' and 3'-ends are separate), n = 100 transcripts. d Triple-tagged single mRNA transcripts in the U2OS cytoplasm (5’— magenta, middle—cyan, 3’—green). e A plot showing the shape of cytoplasmic MKI67 transcripts in U2OS cells (5' and 3'-ends are adjacent), n = 158 transcripts. Adjustments to individual color channels were made. Source data are provided as a Source Data file.

