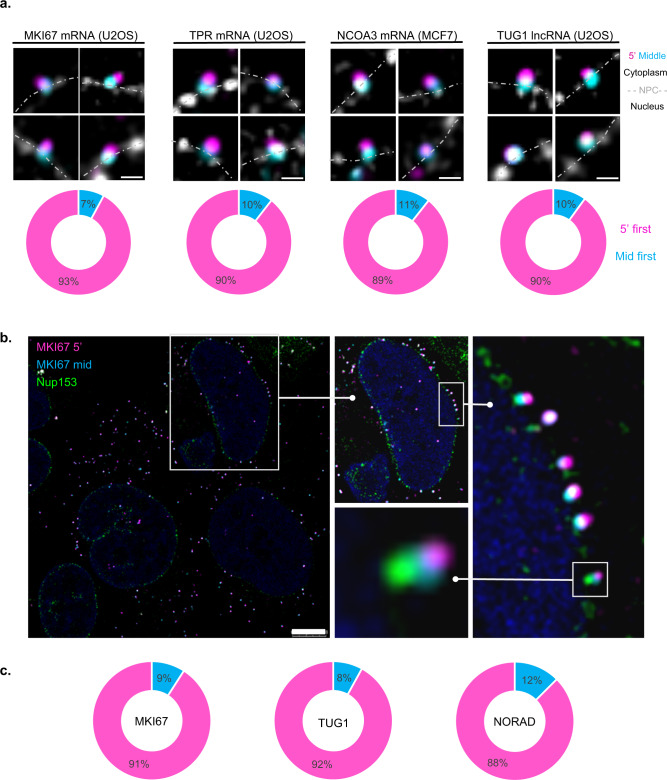
Fig. 5. Export directionality of endogenous mRNAs and lncRNAs.
a MKI67, TPR, NCOA3 mRNAs and TUG1 lncRNA double-tagged transcripts in their 5' and middle regions (5’—magenta, middle—cyan) together with POM121-Cer labeling (gray). Charts describing the percentage of transcripts exiting the pore in a 5’-manner (magenta) or middle-first (cyan). MKI67 n = 105, TPR n = 50, NCOA3 n = 53, TUG1 n = 30 transcripts. Dotted line—nuclear borders; cytoplasm above and nucleus below the line. Scale bar, 0.5 µm. b Double-tagged MKI67 transcripts (5’—magenta, middle—cyan) with endogenous Nup153-mNeonGreen labeling (green). Enlargements are shown in boxes. Scale bar, 8 µm. c Charts describing the percentage of transcripts exiting the pore in a 5’-manner (magenta) or middle-first (cyan) in cells expressing Nup153-mNeonGreen. MKI67 n = 121, TUG1 n = 50, NORAD n = 40 transcripts. Adjustments to individual color channels were made. Source data are provided as a Source Data file.

