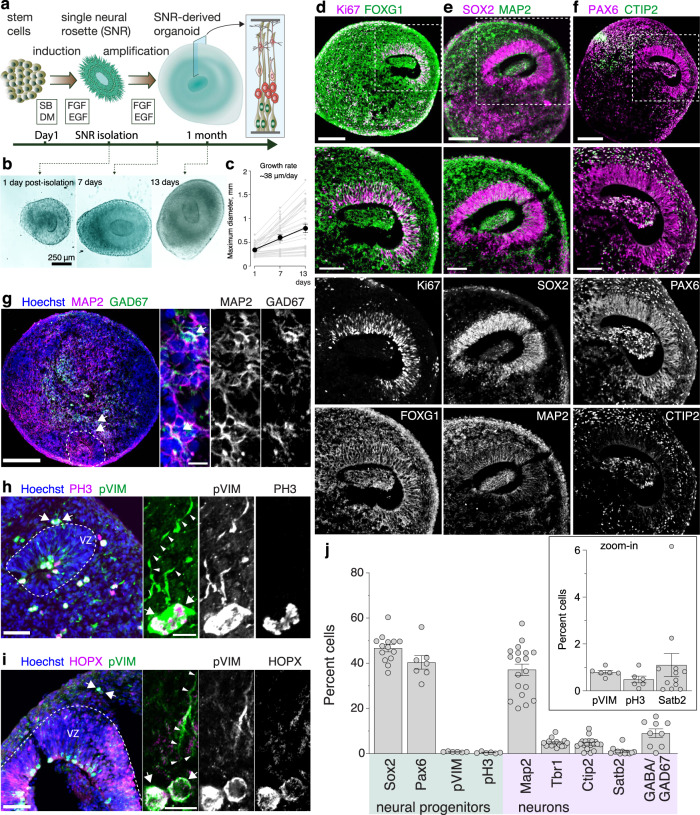
Fig. 1. Generation and characterization of 1-month-old SNR-derived organoids.
a Protocol schematic (elements were drawn by Coni Hoerndli Science Design). b Images of SNR-derived organoids at days 1, 7, and 13 post SNR isolation. c Quantification of initial organoid growth (n = 32 rosettes obtained from H9 and 2242-5 lines). The line shows linear fit of the data. d–i Images of organoid sections immunostained for FOXG1 and Ki67 (d), SOX2 and MAP2 (e), PAX6 and CTIP2 (f), MAP2 and GAD67 (g), PH3 and pVIM (h) HOPX and pVIM (i). j Quantification of cells expressing different cell type-specific markers in organoid sections (n = 17 [SOX2], 7 [PAX6], 6[pVIM] 6[pH3], 19 [MAP2], 14 [TBR1], 19 [Ctip2], 12 [Satb2], 8 [GABA or GAD67] organoids/1–10 sections per organoid, produced in 1–4 differentiation batches from 2242-5, EP2-15, H9, and EYQ2-20 lines). Data are presented as mean ± standard error of the mean (s.e.m.). Scale bars = 250 (b), 200 and 50 (zoom-in) (d–f), 200 and 10 (zoom-in) (g) and 50 and 10 (zoom-in) (h–i) μm. Source data are provided as a Source Data file.

