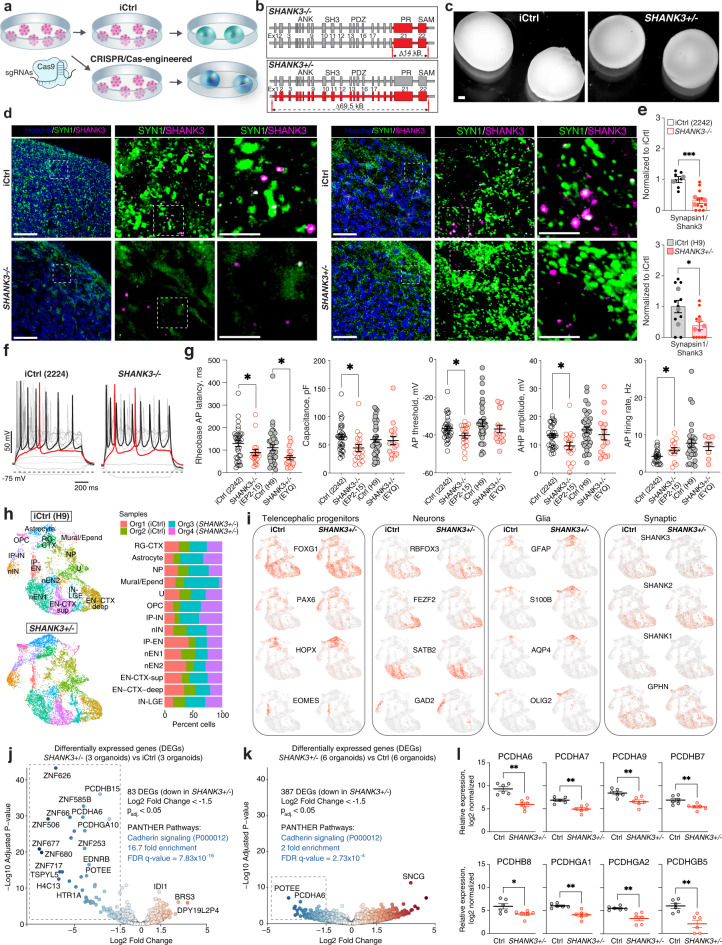
Fig. 10. Cellular and molecular deficits in SHANK3-deficient organoids.
a, b Generation of CRISPR/Cas9-engineered PSC lines and organoids with homozygous and complete hemizygous SHANK3 deletions (SHANK3-/- and SHANK3+/−, respectively) (elements were drawn by Coni Hoerndli Science Design). c Images of 5-month-old iCtrl and SHANK3+/− SNR-derived organoids. d Synaptic stainings using anti-SYN1 and anti-SHANK3 antibodies in iCtrl and SHANK3-deficient organoids (left: iCtrl [2242-5] and SHANK3-/- [EP2-15]; right: iCtrl [H9] and SHANK3+/− [EYQ]). e Quantification of SYN1/SHANK3 puncta (top: n = 7 and 12 sections from 2 iCtrl [2242-5] and 3 SHANK3−/− [EP2-15] organoids produced in two batches, respectively, ***P = 0.0007, unpaired two-sided Mann–Whitney test; bottom: n = 11 and 11 sections from 3 iCtrl [H9] and 3 SHANK3+/−[EYQ] organoids produced in two batches, respectively, *P = 0.029, unpaired two-sided Mann–Whitney test). f Traces of voltage deflections recorded from iCtrl (2242-5) and SHANK3-/- (EP2-15) neurons in response to different somatic current injections (ΔI = 10pA). g Quantified Rheobase AP latency, membrane capacitance, AP threshold, AHP, and AP firing rate for iCtrl and SHANK3-deficient neurons in 5-month-old SNR-derived organoid slices (n = 32, 18, 36, and 17 cells, from 4 iCtrl [2242-5], 3 SHANK3-/- [EP2-15], 11 iCtrl [H9], and 2 SHANK3+/− [EYQ] organoids, [P = 0.053 and 0.039 [Rheobase AP latency], 0.012 [membrane capacitance], 0.038 [AP threshold], 0.011 [AHP], 0.041 [AP firing rate], unpaired two-sided t-test). These cells are also included in analyses presented in Fig. 8i and 9d. h UMAP visualizations of unsupervised clustering of scRNA-seq data from 2 iCtrl [H9] and 2 SHANK3+/− [EYQ] SNR-derived organoids and relative cluster composition (right). These organoids are also included in the clustering results presented in Fig. 5. i Heatmap of expression of different cell-type specific marker genes in iCtrl (H9) and SHANK3+/− (EYQ) organoids. j, k Volcano plot visualizations of DEGs from bulk RNA-seq data obtained from 3 iCtrl (H9) and 3 SHANK3+/− (EYQ) organoids (j) and 6 control and 6 SHANK3+/− organoids. Gene ontology (GO) analysis performed on most downregulated genes (Log2 fold change < −1.5) detected in SHANK3+/− organoids. l Relative expression of clustered protocadherins in 6 control and 6 SHANK3+/− organoids (P = 0.0022 [PCDHA6], 0.0022 [PCDHA7], 0.009 [PCDHA9], 0.009 [PCDHB7], 0.041 [PCDHB8], 0.0022 [PCDHGA1], 0.0022 [PCDHGA2], and 0.0043 [PCDHGB5], unpaired two-sided Mann–Whitney test). Data are mean ± s.e.m. Scale bars = 450 (c), and 50, 20, and 5 μm (d). Source data are provided as a Source Data file.

