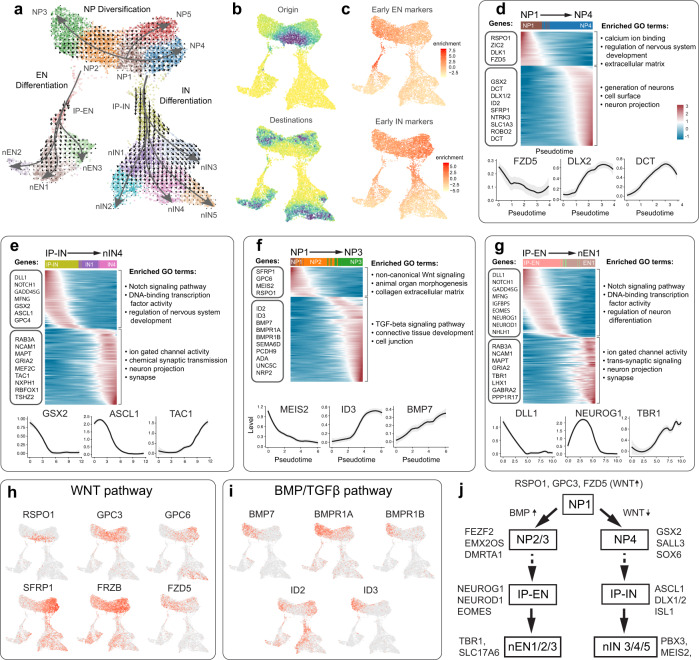
Fig. 3. Transcriptional programs and signaling pathways associated with specification of excitatory and inhibitory neural lineages in 1-month-old SNR-derived organoids.
a RNA velocity vector fields and developmental trajectories. Small arrows indicate extrapolated future states of cells. Large arrows indicate branching lineage trajectories constructed using Slingshot and initialized using the origin and end states of the Markov simulation. b The origin and end states of the differentiation landscape determined using Markov random walk simulation on the velocity field. The density of cells at the end of the simulation is shown using the color scale ranging from yellow (low) to blue (high). c Enrichment of early differentiation genes from the EN and IN differentiation trajectories. d–g Smoothed gene expression heatmaps of the top 150 genes differentially expressed along the NP1–NP4 (d), IP-IN–nIN4 (e), NP1–NP3 (f), and IP-EN–nEN1 (g) trajectories. Genes are ordered by peak expression time on the pseudotime axis. Selected genes are listed on the left and shown at the bottom. The top gene ontology terms are listed on the right. h–i UMAP visualization of expression of WNT (h) and BMP/TGFβ (i) signaling pathways genes expression. j Cartoon depicting selected genes and signaling pathways associated with specification of EN and IN lineages in SNR-derived organoids. NP neural progenitor, IP intermediate neural progenitor, nEN newborn excitatory neuron, nIN newborn inhibitory neuron.

