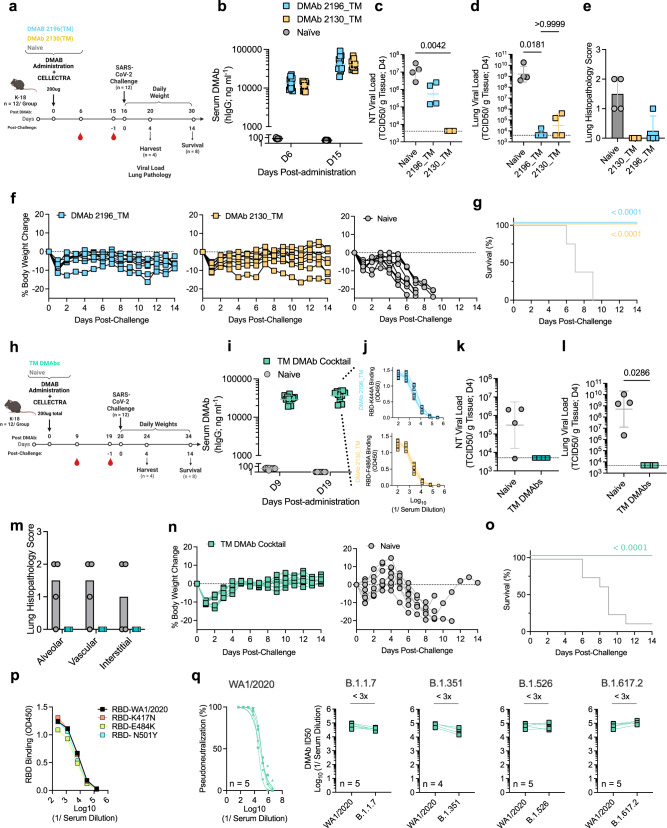
Fig. 3. Prophylactic delivery of 2196_TM and 2130_TM DMAbs protect mice against lethal SARS-CoV-2 challenge.
a-g DMAb prophylaxis against lethal SARS-CoV-2 (USA-WA1/2020) (monotherapy). a Schematic of challenge in 6–8-week-old female K-18 mice (n = 12 independent biological replicates). b Serum DMAb levels in individual animals (n = 12) following plasmid delivery (with group GM ± GSD indicated). c–e Measurements of viral control (TCID50/g tissue) at D4 (n = 4 independent biological replicates). Viral loads (with group GM ± GSD indicated) in the c, nasal turbinate (NT) and d lung were compared using a Kruskal–Wallis test followed by Dunn’s post hoc analysis. P values indicated. Horizontal lines indicate LOD. e Histopathology scores for H&E-stained lung sections. Group averages (±SD) and shown. f, g Challenge outcome in individual animals (n = 8 independent biological replicates). f Body weight change (%) for each animal and g Survival (%) were monitored. Survival curves were compared using a Mantel–Cox Log-rank test. P values indicated. h–o DMAb prophylaxis against lethal SARS-CoV-2 (USA-WA1/2020) following co-administration (cocktail). h Schematic of lethal challenge in 6–8-week-old male K−18 mice (n = 12 independent biological replicates). i Serum DMAb levels in individual animals (n = 12) are shown. Group GM (±GSD) indicated. j Sera reactivity against epitope-specific mutant RBDs; binding curves (derived from technical replicates) for each animal sample (n = 8 biological replicates) are shown. k–m Measurements of viral control (TCID50/g tissue) at D4 (n = 4 independent biological replicates). Viral load (GM (±GSD) indicated) in the k NT and l lung were compared using a two-tailed Mann–Whitney U test. P values indicated. Horizontal lines indicate LOD. m Histopathology scores for H&E-stained lung sections. Group averages (±SD) are shown. n, o Challenge outcome in individual animals (n = 8 independent biological replicates). n Body weight change (%) and o Survival (%) were monitored. Survival curves were compared using a Mantel–Cox Log-rank test. P values indicated. p Relative binding of pooled sera from cocktail-expressing challenge mice to the indicated mutant RBDs relative to parental D614G RBD; average binding curves for each pool (derived from technical replicates) are shown. q Neutralizing activity of individual sera (n = 5) against variant pseudoviruses. Neutralization curves against USA-WA1/2020 (best-fit lines and individual data points derived from technical replicates) are shown. Matched ID50s against the other variants relative to USA-WA1/2020 are shown for each sample. The fold change (x) in ID50 is indicated. Source data are provided as a Source Data file.

