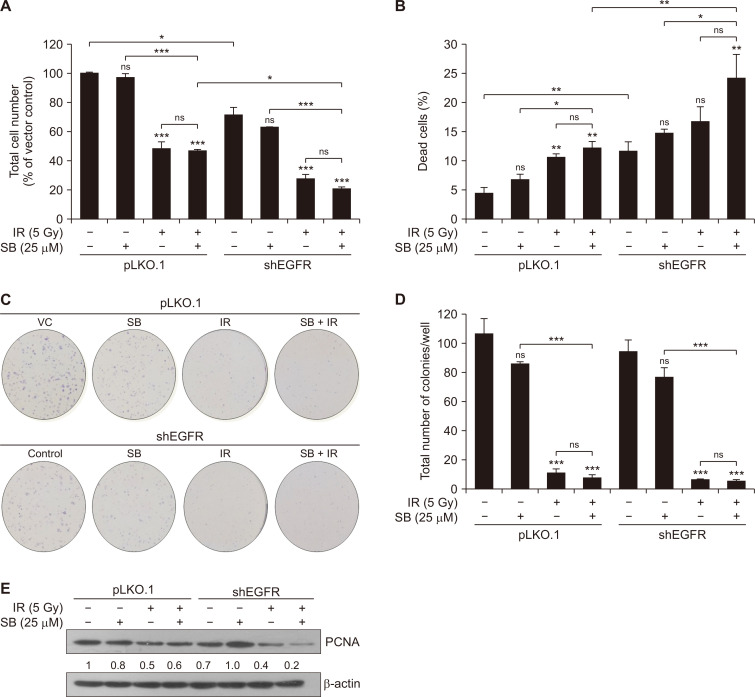
Figure 2. SB enhanced IR-induced cytotoxicity in EGFR-knockdown DU145 cells.
Briefly, pLKO.1 (vector control) and shEGFR DU145 cells were seeded at a density of 4 × 10⁴ cells/well and treated with either SB (25 µM) or IR (5 Gy) or their combination. After the 48-hour treatments, cells were harvested and counted by using the trypan blue assay. Data were quantified and represented as the total number of cells (A) and percent cell death (B). Briefly, 600 cells/well were seeded in a 6-well plate for pLKO.1 and shEGFR DU145 cells and after 24 hours, treated with silibinin and/or IR for the clonogenic assay. (C) Representatives images of the colonies assesed through crystal violet (0.05%) staining at 10 days for various treatment groups. (D) Quantitative data represented as the total number of colonies per well. (E) DU145 knockdown cells were treated with SB (25 µM) and/or IR (5 Gy) and harvested after 48 hours. Cell lysates were prepared and Immunoblotting was done for PCNA and β-actin was used as loading control. Data are presented as means ± SE of triplicate samples for each treatment. Results are representative of three independent experiments. VC, vector control; SB, silibinin; IR, ionizing radiation; EGFR, EGF receptor; Gy, gray; ns, not significant; shEGFR, short hairpin EGFR; PCNA, proliferating cell nuclear antigen; SE, standard error. *P < 0.05, **P < 0.01, *** P < 0.001.

