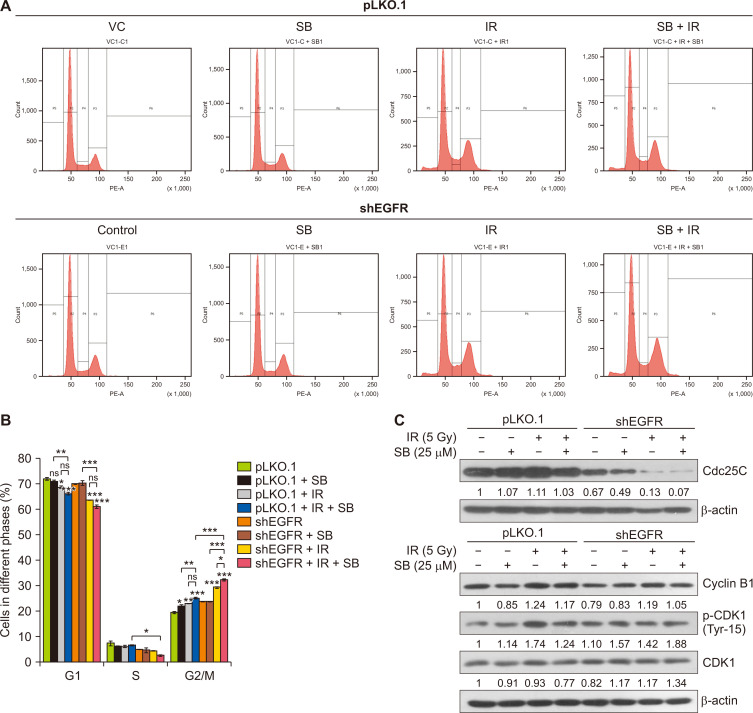
Figure 3. SB augments IR-induced G2/M arrest in EGFR-knockdown DU145 cells.
pLKO.1 and EGFR-knockdown DU145 cells were seeded at a density of 4×10⁴ cells/well in 12-well culture plates and treated with SB (25 µM) and/or IR (5 Gy). After the 48-hour treatments, cells were harvested and processed for cell cycle analysis by flow cytometry as described in MATERIALS AND METHODS. (A) Representative histogram showing cell cycle phase distribution in various treatments. (B) Quantitative data represented as a percent cell cycle distribution of different phases of cell cycle in various treatments. (C) pLKO.1 and EGFR-knockdown DU145 cells were seeded and treated with a low dose of SB (25 µM) and/or IR (5 Gy), and whole cell lysates were prepared and analyzed for the expression of Cdc25C, CDK1, p-CDK1 (Tyr15) and Cyclin B1 proteins. β-actin was used as a loading control. Data are presented as mean ± SE of duplicate independent wells and are representative of three independent sets of experiments. SB, silibinin; IR, ionizing radiation; EGFR, EGF receptor; VC, vector control; S, synthesis; G1, first gap; G2, second gap, M, Mitosis phases of the cell cycle; shEGFR, short hairpin EGF receptor; CDK1, cyclin-dependent kinase 1; p-CDK1, phospho-CDK1; Gy, gray; SE, standard error; ns, not significant. *P < 0.05, **P < 0.01, ***P < 0.001.

