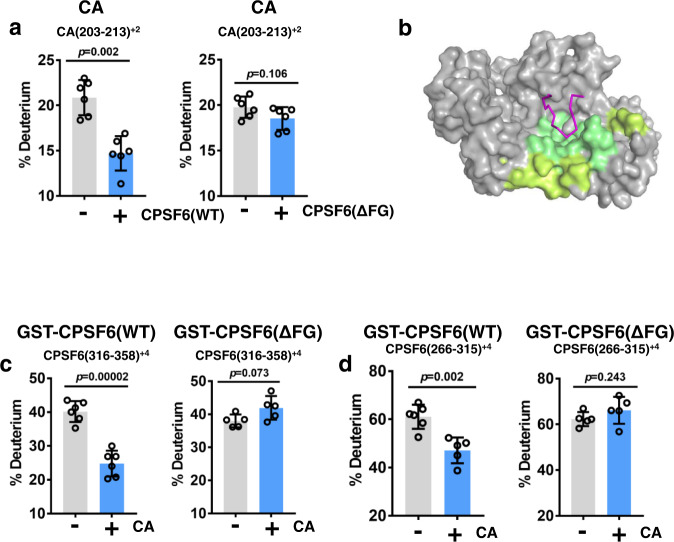
Fig. 6. HDX-MS analysis of CPSF6(LCR-FG-LCR) binding to IP6-stabilized CA tubes.
a The 10 s HDX results for the CA peptide (aa 203-213) that is specifically protected upon addition of WT GST-CPSF6261-358 but not GST-CPSF6261-358(ΔFG). Gray and cyan bars show HDX values for the indicated CA peptide in the absence vs presence of added GST-CPSF6. Consolidated results from differential HDX-MS for protection in CA are shown in Supplementary Fig. 14a). The averaged data (+/− SD) from six independent experiments are shown. Statistical analysis of samples was carried out with Student’s two-sample, two-tailed t-test. Source data are provided as a Source Data file (b) Our X-ray structure of the CAhex + IP6 + CPSF6313-327 with protected CA regions colored according to the scale bar in Supplementary Fig. 14a and the regions showing no significant protection colored gray. For clarity, only one hydrophobic pocket formed by two adjoining CA monomers (colored gray) is shown. CPSF6 FG peptide is in magenta. The 10 s HDX results for CPSF6 peptides aa 316-358 containing the FG peptide + C-terminal LCR (c) and aa 266-315 containing N-terminal LCR (d) that are specifically protected in WT GST-CPSF6261-358 but not in GST-CPSF6261-358(ΔFG) upon incubation with IP6-stabilized CA(A92E) tubes. Gray and cyan bars show HDX values for the indicated CPSF6 peptides in the presence vs absence of IP6-stabilized CA(A92E) tubes, respectively. Consolidated results from differential HDX-MS comparing WT GST-CPSF6261-358 vs GST-CPSF6261-358(ΔFG) in the presence of IP6-stabilized CA(A92E) tubes are shown in Supplementary Fig. 14b. The averaged data (+/− SD) from six independent experiments are shown. Statistical analysis of samples was carried out with Student’s two-sample, two-tailed t-test Source data are provided as a Source Data file.

