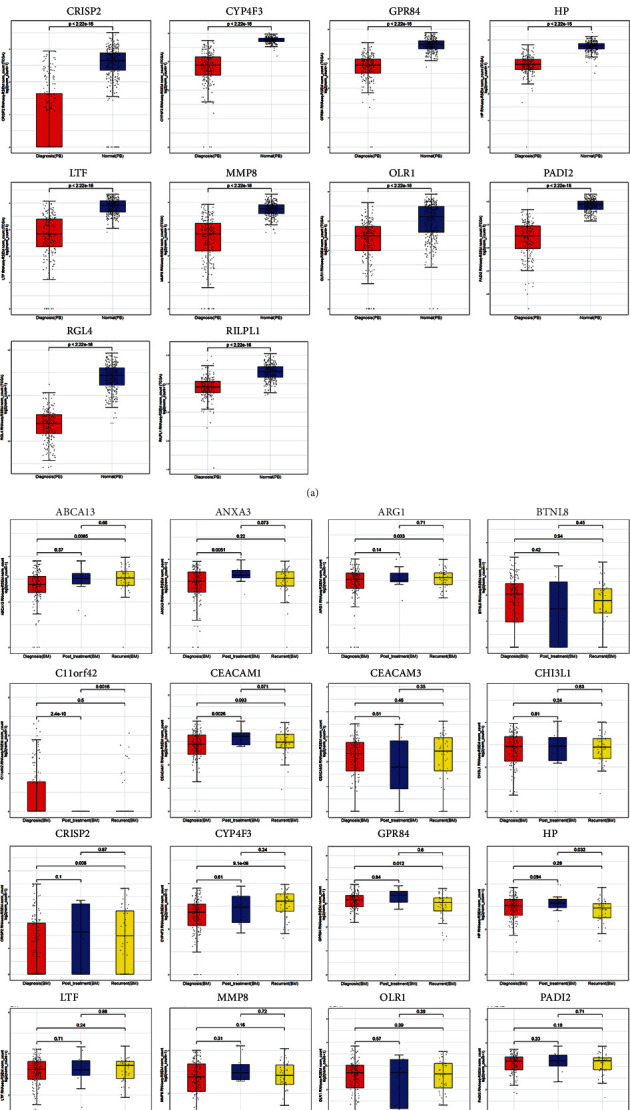
Figure 4.

Analyses of hub gene expression levels in AML PB samples, healthy whole blood samples, and AML BM samples of different stages. The lines inside the boxes represent mean values. (a) Comparison of AML PB samples of the diagnosis stage and healthy whole blood samples. (b) Comparison of AML BM samples of diagnosis stage, posttreatment stage, and recurrent stage.
