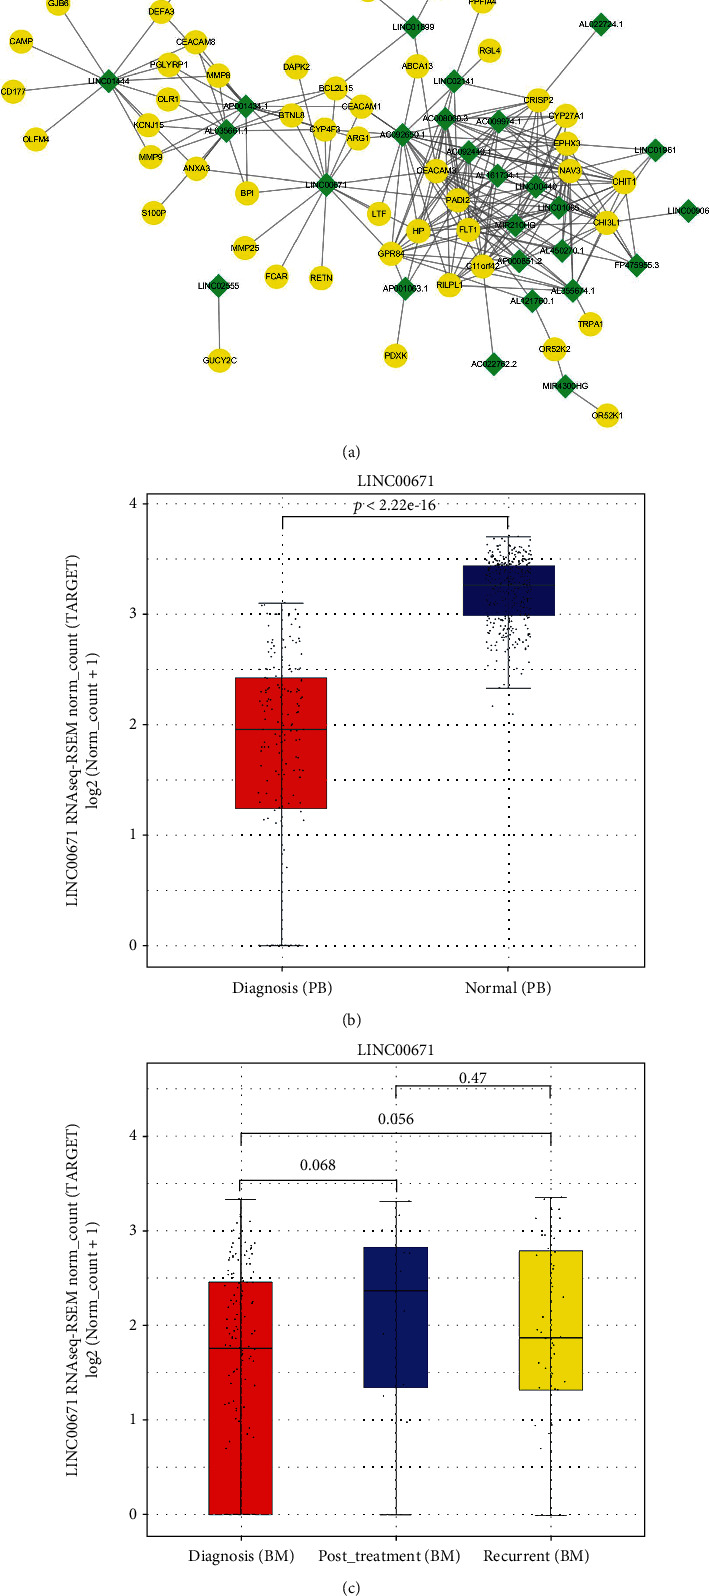
Figure 6.

Pearson's correlation analysis between mRNAs and lncRNAs. (a) Coexpression network of 127 mRNAs and 28 lncRNAs with a |R| > 0.8 (P < 0.05) based on Pearson's correlation analysis. Yellow round nodes indicate mRNAs, and green diamond nodes indicate lncRNAs. (b) The expression analysis of LINC00671 between AML PB samples and healthy whole blood samples. The lines inside the boxes represent mean values. (c) The expression analysis of LINC00671 among AML BM samples from diagnosis stage, posttreatment stage, and recurrent stage. The lines inside the boxes represent mean values.
