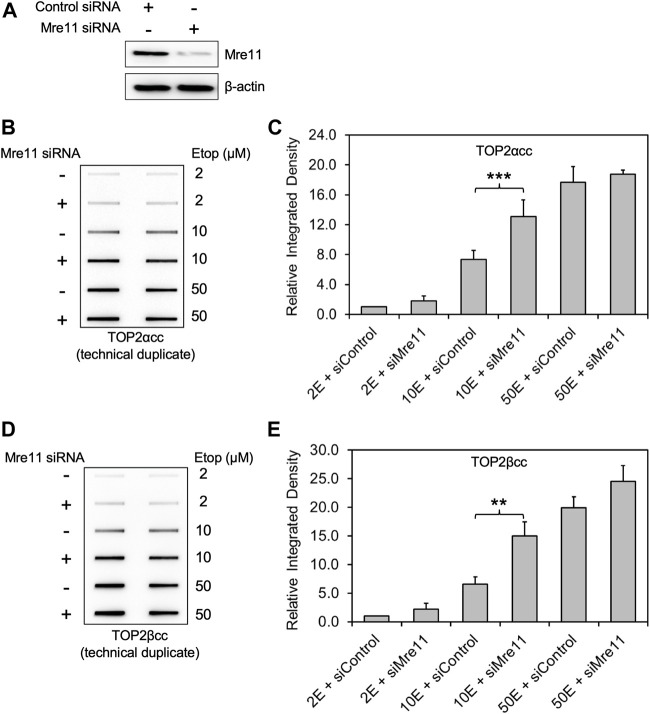
FIGURE 1.
Knockdown of MRE11 by siRNA increases the level of etoposide-induced TOP2-DNA complexes as detected by ICE. RH30 cells were transfected with non-targeting siRNA control (siControl) or siRNA targeting MRE11 (siMRE11), followed by treatment with etoposide (Etop) at the indicated concentrations. (A) Western blot assessing MRE11 knockdown efficiency. Semi-quantitative image analysis of immunoblots using ImageJ indicates that treatment with siMre11 resulted in 94% knockdown of endogenous MRE11 (quantitation not shown). (B) ICE assay illustrating TOP2αcc in MRE11 knockdown cells. The panel illustrates a representative assay. In all cases, the assay includes technical replicates. At least three biological replicates were performed for all experimental conditions. No detectable signal is ever observed under our conditions in cells treated with a solvent control, over more than 20 experiments. Samples without etoposide were therefore not typically analyzed in ICE assays. (C) Densitometric analysis of all experiments comparing relative integrated densities of TOP2αcc signal amongst MRE11 knockdown and control cells treated with 2 μM, 10 and 50 μM etoposide (2E, 10E and 50E). Integrated density of TOP2αcc signal of each group was normalized to that of control cells treated with 2 μM etoposide. *** denotes p-value < 0.001, determined using Student’s t-test. Samples not marked with a bar did not result in a statistically significant difference. (D) ICE assay illustrating TOP2βcc. The panel illustrates a representative assay. In all cases, the assay includes technical replicates. (E) Densitometric analysis of all experiments comparing relative integrated densities of TOP2βcc signal amongst MRE11 knockdown and control cells treated with 2 μM, 10 and 50 μM etoposide. Integrated density of TOP2αcc signal of each group was normalized to that of control cells treated with 2 μM etoposide. ** denotes p-value < 0.01.

