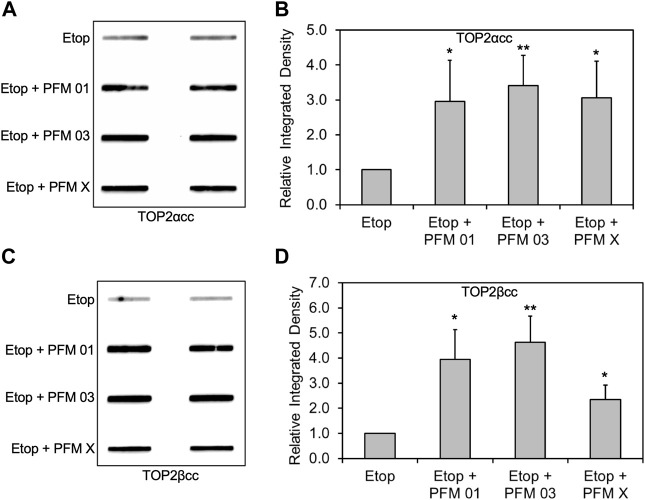
FIGURE 4.
Inhibition of MRE11 endonuclease activity results in accumulation of etoposide-induced TOP2/DNA complexes. RH30 cells were pre-treated with 25 μM PFM01, 25 μM PFM03, or 25 μM PFM X for 4 h. Etoposide (10 μM) was added, and incubation was continued for 2 h. Cells were then harvested for ICE assays. (A) Representative ICE assay measuring the levels of TOP2αcc (B) Densitometric analysis of all assays comparing relative integrated densities of TOP2αcc signals. Integrated density of TOP2αcc signal of each group was normalized to that of cells treated with etoposide alone. (C) Representative ICE assay measuring the levels of TOP2βcc. (D) Densitometric analysis of all assays comparing relative integrated densities of TOP2βcc signals. Integrated density of TOP2βcc signal of each group was normalized to that of cells treated with etoposide alone.

