FIGURE 5.
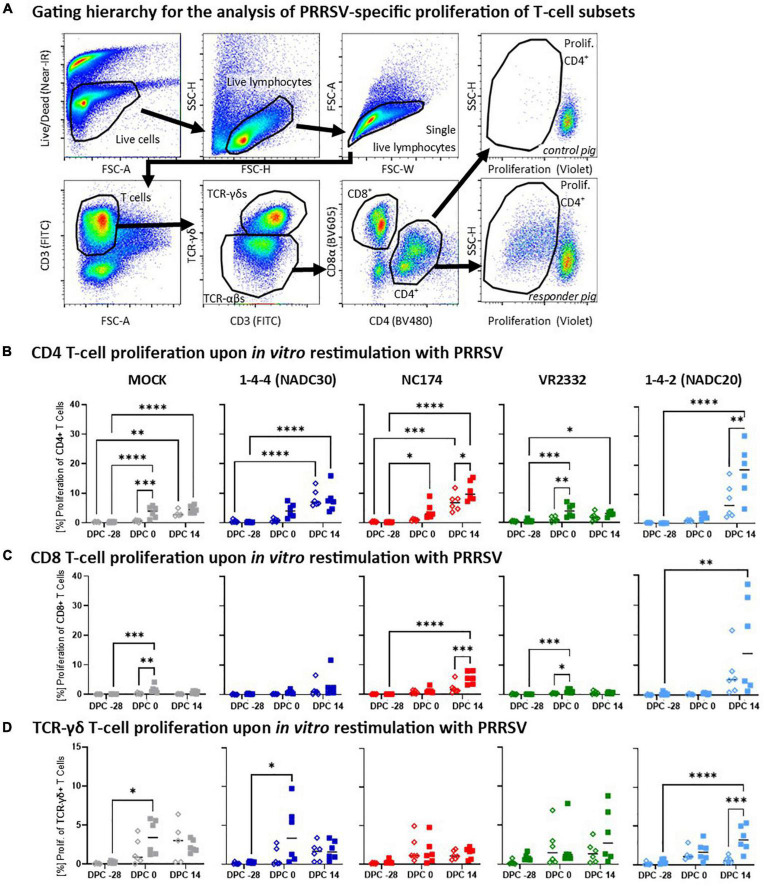
Heterologous vaccine immunogenicity—proliferation of CD4, CD8, and TCR-γδ T cells. Panel (A) shows the gating hierarchy to assess the heterologous proliferative response of T-cell subsets to the respective PRRSV type-2 challenge strains. A live/dead discrimination dye was included to exclude dead cells. Live cells were used to identify live lymphocytes via a FSC/SSC lymphocyte gate. From live lymphocytes, doublets were excluded using a FSC-width (FSC-W)/FSC-area (FSC-A) gate on singlets. These single living lymphocytes were used to gate on T cells (FSC-A/CD3), and further to discriminate TCR-αβ and TCR-γδ T cells. TCR-αβ T cells were further divided into CD4 and CD8 T cells via their CD4/CD8α expression profile. Proliferation of the CD4, CD8, and TCR-γδ T cells was identified via a violet proliferation dye. Two examples demonstrate representative staining patterns of a control animal (top right plot) and a high responder animals (bottom right plot). Panels (B–D) show the proliferative responses of CD4 (B), CD8 (C), and TCR-γδ T cells (D) according to their challenge groups—MOCK (gray), NC174 (red), NADC20 (light blue), NADC30 (dark blue), and VR2332 (green). The black bars represent the median values; in addition, individual data points are shown for MOCK vaccinated animals (open diamonds) and MLV vaccinated animals (filled squares). Data were statistically analyzed using a 2-way ANOVA with time and vaccination as the two parameters and Tukey’s multiple comparison test. ****p < 0.0001, ***p < 0.001, **p < 0.01, *p < 0.05.

